RSS

The GTA Housing Market This October: What’s Actually Happening?

October brought a subtle shift across the Greater Toronto Area. While persistent economic uncertainty, high fixed mortgage rates, and the Bank of Canada’s recent 25-basis-point rate hike to 2.50% kept a chunk of prospective buyers cautious, the real story this fall is happening on the supply side.

New listings dropped by 11.9% year-over-year (and down 14.1% month-over-month), steadily draining active inventory. This pullback in supply prevented standing inventory from flooding the market and helped firm up average selling prices across the region compared to late summer.

October at a Glance: The Key Numbers (All TRREB Areas)

  • Average Selling Price: $1,024,108 (-2.7% YoY | +1.8% MoM)

  • Total Sales: 5,603 (-7.9% YoY | +11.2% MoM)

  • New Listings: 14,173 (-11.9% YoY | -14.1% MoM)

  • Active Listings: 25,098 (-10.0% YoY | -4.0% MoM)

  • Average Time on Market: 31 Listing Days (LDOM) / 49 Property Days (PDOM)

  • Average Sale-to-List Price Ratio: 97%

  • Months of Inventory: 4.48 Months (Balanced Market)

Macro Economic & Rate Context

  • Bank of Canada Move: On October 28, the Bank of Canada bumped its overnight rate up by 25 bps to 2.50%, pushing prime rates to 4.50% and lowest variable mortgage rates to around 3.70%.

  • Fixed Mortgage Rates: Tracked stickier government bond yields, holding firm in the 5.49% to 6.19% range.

  • Inflation & Growth: The rate bump was triggered by core inflation sitting at 3.1% in September and strong Q2 GDP growth (3.3%), signaling that policy rate cuts remain on pause for now.

  • Consumer Sentiment: Trade tensions and employment uncertainty continued to induce buyer hesitation, though lower selling prices compared to 2023/2024 peak levels have helped keep monthly mortgage payments manageable.

Property Type Breakdown across TRREB

  • Detached Homes: Recorded 2,693 sales (-6.2% YoY) with an average price of $1,310,627 (-3.2% YoY).

  • Semi-Detached Homes: Totaled 546 sales (-8.1% YoY) with an average selling price of $1,024,907 (-0.8% YoY).

  • Townhouses: Posted 508 sales (-11.0% YoY) at an average price of $905,385 (-5.0% YoY).

  • Condo Apartments: Saw 1,385 sales (-10.4% YoY) with an average selling price of $621,400 (-5.8% YoY).

Inside the Regions: Toronto vs. Durham Region

City of Toronto (416)

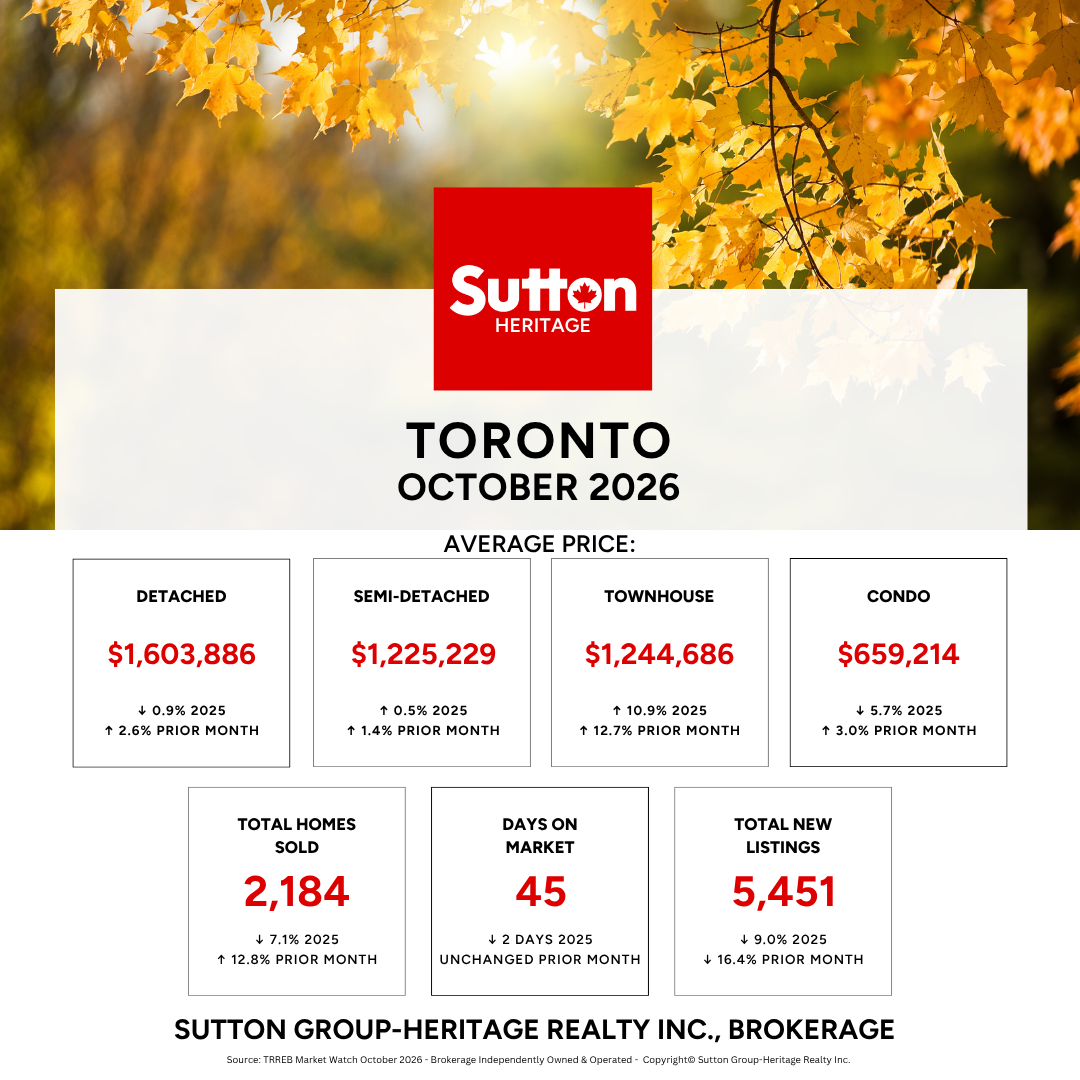
Toronto proper demonstrated strong month-over-month price momentum across almost all property types, bolstered by a sharp 16.4% drop in new listings MoM.

  • Total Sales: 2,184 (-7.1% YoY | +12.8% MoM)

  • Average Price: $1,075,627

  • Detached: $1,603,886 (-0.9% YoY | +2.6% MoM)

  • Semi-Detached: $1,225,229 (+0.5% YoY | +1.4% MoM)

  • Townhouse: $1,244,686 (+10.9% YoY | +12.7% MoM) — The standout performer in the 416 core.

  • Condo Apartment: $659,214 (-5.7% YoY | +3.0% MoM)

  • Days on Market: 45 Property Days

Durham Region (905)

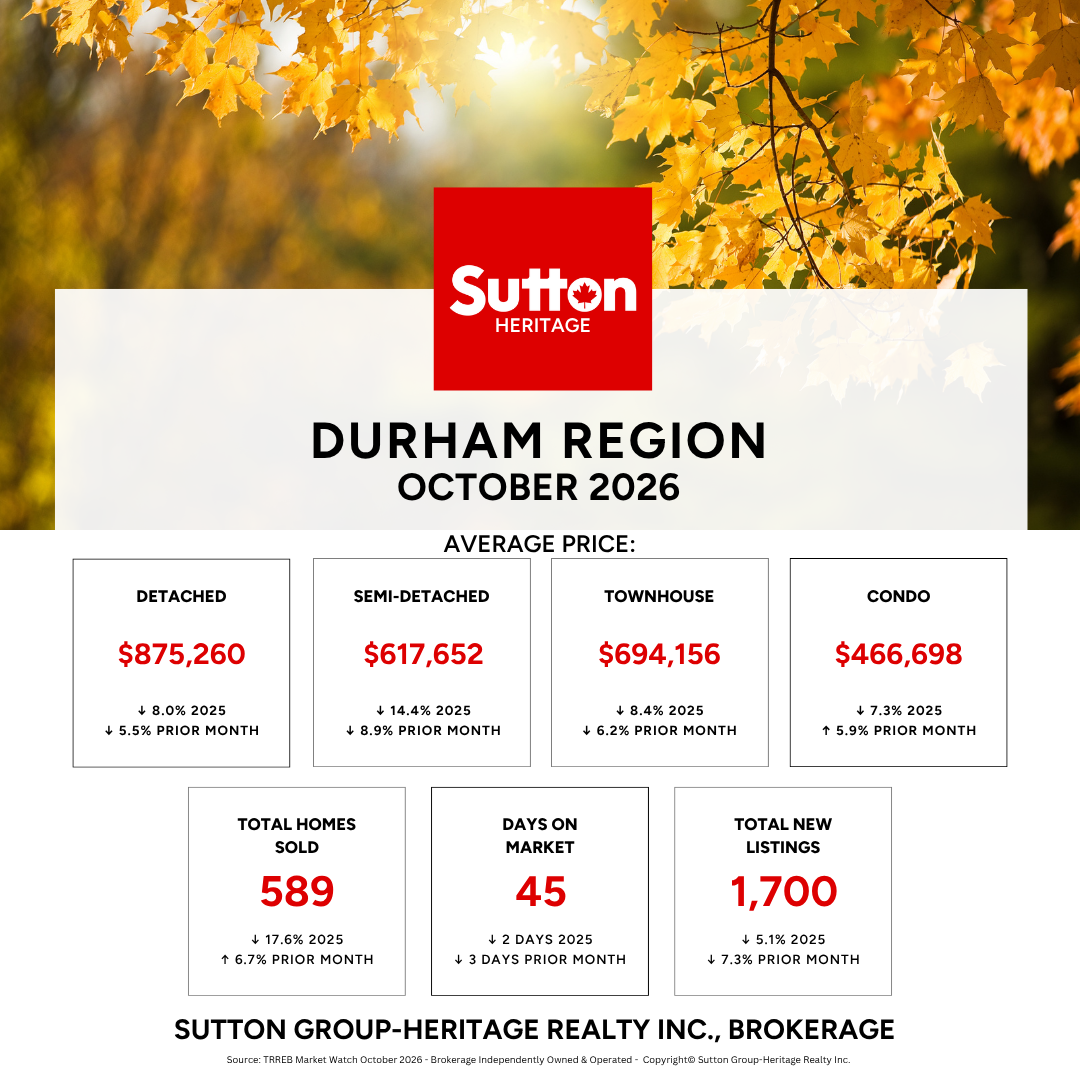
Durham Region offered accessible pricing points for buyers, though freehold values experienced modest softening month-over-month.

  • Total Sales: 589 (-17.6% YoY | +6.7% MoM)

  • Average Price: $793,024

  • Detached: $875,260 (-8.0% YoY | -5.5% MoM)

  • Semi-Detached: $617,652 (-14.4% YoY | -8.9% MoM)

  • Townhouse: $694,156 (-8.4% YoY | -6.2% MoM)

  • Condo Apartment: $466,698 (-7.3% YoY | +5.9% MoM)

  • Days on Market: 45 Property Days

What Does This Mean for You Heading Into Year-End?

For Buyers: Substantial Negotiating Power

  • Leverage in Negotiations: With average sale-to-list price ratios holding at 97%–98% and homes averaging 45 to 49 property days on market, buyers have room to include conditions and negotiate terms.

  • Price Floor Stability: Active inventory is down 10% year-over-year, meaning prices are stabilizing rather than plummeting. If you're waiting for a drastic price crash before entering the market, current inventory trends suggest prices are holding steady.

For Sellers: Strategic Pricing is Essential

  • Compete on Presentation & Price: Shrinking active inventory provides support against steep price drops, but elevated days on market mean buyers are taking their time.

  • Realistic Alignment: Properties priced at current fair market value are moving smoothly, whereas over-priced listings are sitting and requiring price adjustments.

Looking Ahead to Q4

As we move toward the final weeks of 2026, the GTA market is settling into a balanced state. Supply contraction is keeping prices grounded around the $1.00M–$1.02M mark, while elevated mortgage rates prevent a sudden surge in buyer frenzy. Expect steady, measured activity heading into the winter months.

Need Strategy, Not Guesswork?

Whether you’re planning your next move in Toronto, Durham Region, or across the GTA, having a localized strategy makes all the difference. Reach out today for a personalized consultation!

Get the complete view on markets in Durham, Markham/Stouffville and Port Hope/Cobourg.

Read

The GTA Housing Market This September: What's Actually Happening?

If you’ve been watching the Toronto and Durham real estate markets, you might be wondering why the news feels full of mixed signals. Headline numbers talk about sales dipping, while on the ground, buyers and sellers are navigating a market shaped by changing mortgage dynamics, seasonal inventory surges, and economic holding patterns.

Let's break down what actually happened across the Greater Toronto Area, Toronto, and Durham Region in September 2026, and what it means for your next move.

The Big Picture across the GTA

Across the entire Toronto Regional Real Estate Board (TRREB) area, September showed a market where buyers remained cautious amidst borrowing cost uncertainty, while sellers adjusted to early autumn expectations:

  • Total Sales: 5,040 (-9.0% YoY)

  • Average Selling Price: $1,006,409 (-5.1% YoY)

  • New Listings: 16,500 (-14.4% YoY)

  • Active Listings: 26,131 (-9.3% YoY)

  • Days on Market (Avg. LDOM): 34 days

  • Property Days on Market (Avg. PDOM): 51 days

  • Sales-to-List Price Ratio: 98%

While overall sales slowed compared to last September, supply also contracted, keeping inventory from over-accumulating and keeping negotiation room grounded around 98% of list price.

City of Toronto Market Breakdown

Toronto saw a classic post-Labour Day influx of new listings alongside a notable uptick in month-over-month sales activity.

Key Toronto Insights

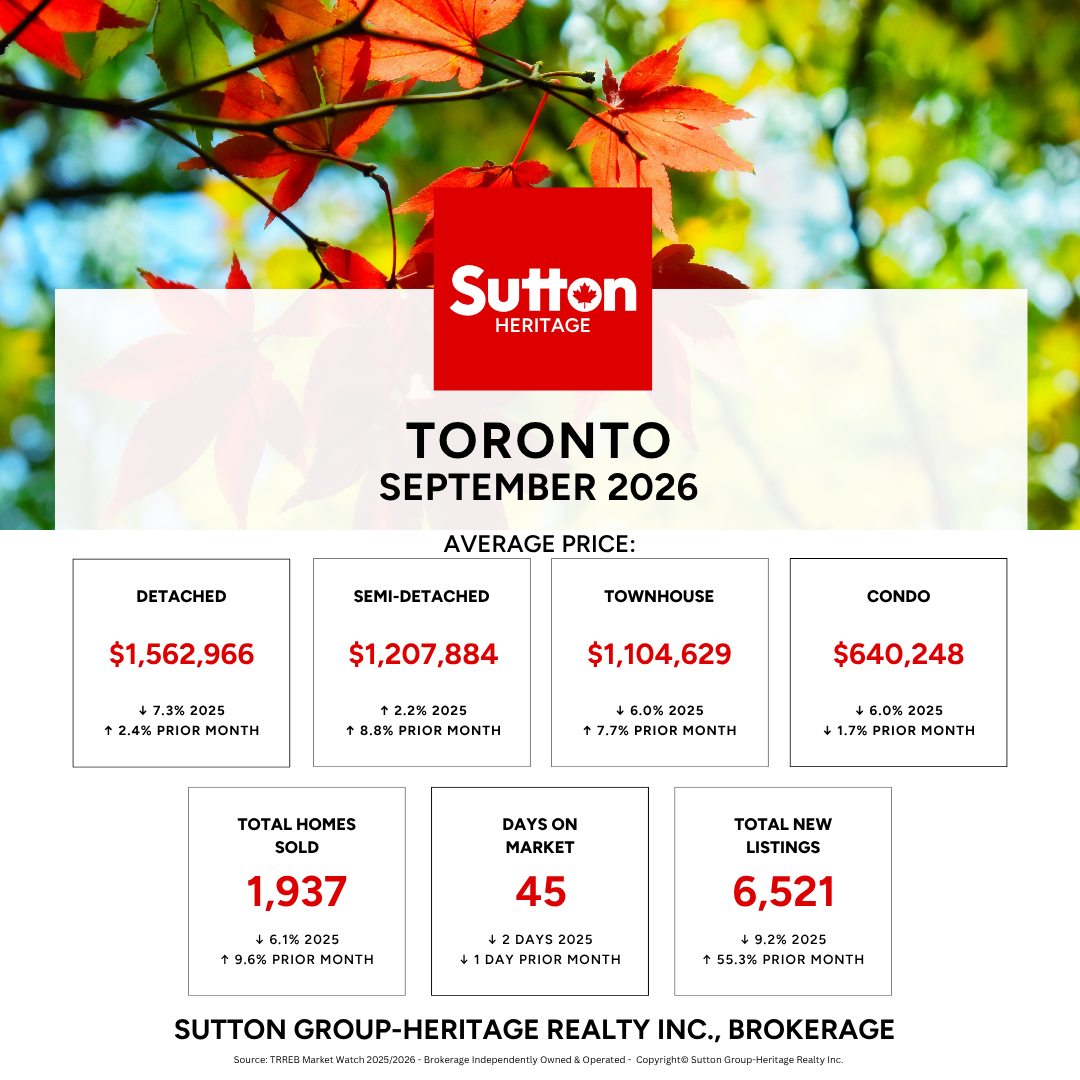
  • Freehold Demand Bounced Back Month-over-Month: Semi-detached homes ($1,207,884) and townhouses ($1,104,629) posted strong month-over-month price growth of +8.8% and +7.7% respectively, demonstrating sustained buyer demand for mid-tier freehold options.

  • Fall Inventory Arrived: New listings surged +55.3% from August to 6,521 homes, offering buyers significantly more choice than in the summer months.

  • Condos Remain Soft: Condo average prices dipped slightly month-over-month (-1.7%) to $640,248 as higher inventory levels in the condo sector gave buyers the upper hand during negotiations.

Durham Region Market Breakdown

Durham Region continued to offer an appealing blend of relative affordability and community appeal, though seasonal shifts were clearly evident.

Key Durham Insights

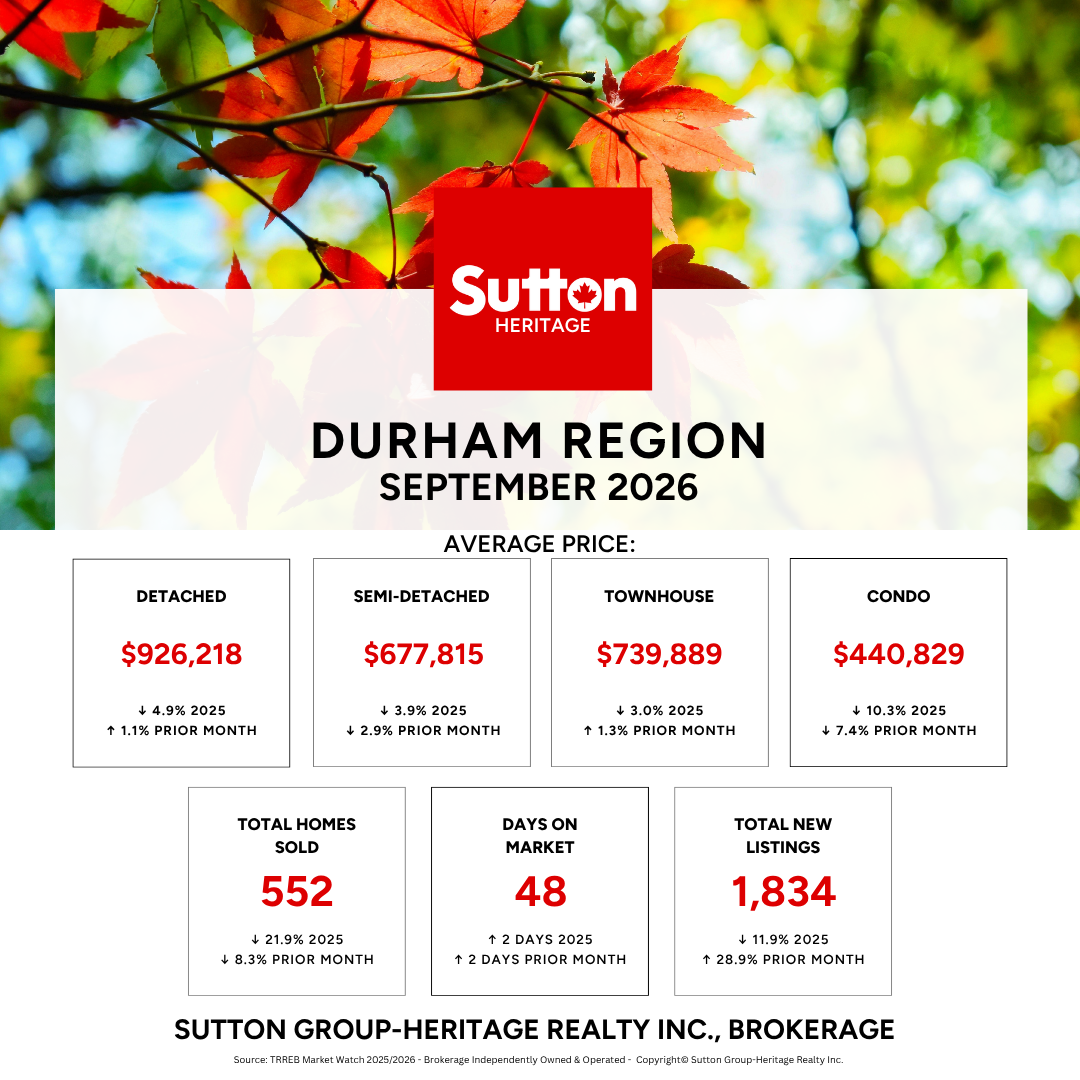
  • Detached & Townhouse Resilience: Single-family detached homes ($926,218) and townhouses ($739,889) both saw modest price increases month-over-month (+1.1% and +1.3%), reflecting steady family-home demand across Ajax, Whitby, Oshawa, and Pickering.

  • Slower Pace of Sales: Total sales dropped -8.3% month-over-month to 552 units, while Days on Market ticked up to 48 days, giving buyers extra room to inspect properties and finalize financing without feeling rushed.

  • Condo Opportunity: Condo apartment prices in Durham dropped to $440,829 (-7.4% MoM), creating an accessible entry point for first-time buyers looking to get onto the property ladder.

Behind the Numbers: Interest Rates & Mortgage Dynamics

Heading into October, borrowing dynamics played a major role in buyer behavior:

  1. The Fixed vs. Variable Gap: While the Bank of Canada held its overnight policy rate steady at 2.25% in its early September announcement, 5-year fixed mortgage rates edged upward due to rising bond yields. Variable rate options remained lower, creating a wider-than-usual rate spread and forcing buyers to choose between fixed stability or lower initial variable payments.

  2. Pent-Up Demand in a Holding Pattern: Many prospective buyers are sitting on pre-approvals, waiting for inflation trends and rate expectations to settle before locking into longer-term financing.

  3. Strategic Pricing Matters: With new listings up significantly from August (+55.3% in Toronto, +28.9% in Durham), sellers who price accurately based on recent local comps are securing firm sales, while over-priced listings are sitting past the 40-to-50-day mark.

What This Means for You

  • For Buyers: Fall inventory is here. With properties taking an average of 45 to 48 days to sell and sale-to-list price ratios holding near 98%, you have time to perform due diligence, negotiate terms, and explore mortgage structure options without pressure.

  • For Sellers: Buyers are active but price-sensitive. Proper presentation, aggressive market positioning, and realistic pricing strategies are key to standing out among the expanding fall competition.

Have questions about what these numbers mean for your neighbourhood or specific street? Contact our team today for a tailored evaluation of your home!

Read

🏡 April 2026 GTA Real Estate Market Update

While the spring surge is in full effect with sales up 7% year-over-year, a significant volume of active listings is keeping the market balanced and providing buyers with continued negotiating power.


🔍 By the Numbers: April at a Glance

  • Total Sales: 5,946 (+7.0% YoY)

  • Average Selling Price: $1,051,969 (–4.9% YoY)

  • Active Listings: 25,110 (–6.4% YoY)

  • New Listings: 17,097 (–9.3% YoY)

  • Sales-to-New Listings Ratio (SNLR Trend): 34.6%

  • Days on Market (Avg. PDOM): 43 days

  • Months of Inventory (Trend): 4.9 months — Market is solidly BALANCED.


🧠 Top Takeaway

Despite a healthy 7% increase in sales activity, the GTA currently has 4.9 months of inventory on a trend basis. This high level of choice for buyers is the primary reason why average selling prices have remained nearly 5% lower than last year, even as we move into the peak spring season.


What's happening locally? Durham Region & Toronto Insights

While the overall GTA is tightening, specific regions are moving at different speeds.


🏘 Segment Performance

Detached Homes

  • Total Sales: 2,759 (+9.2% YoY)

  • Average Price: $1,372,688 (–4.1% YoY)

  • Market Status: Balanced. Detached buyers are finding more opportunities than last year as prices edge down despite rising sales.

Condo Apartments

  • Total Sales: 1,553 (+9.1% YoY)

  • Average Price: $635,653 (–6.3% YoY)

  • Market Status: Buyer-Leaning. Condos remain the most affordable entry point and continue to offer the most significant price discounts compared to 2025.

Durham Region

  • Average Price: $844,018

  • Months of Inventory: 3.5 months

  • Status: While tighter than the GTA average, Durham has moved into a more comfortable balanced territory.

City of Toronto

  • Average Price: $1,091,761

  • Months of Inventory: 4.9 months

  • Status: Solidly a Buyer's Market. With nearly 5 months of supply, Toronto buyers have substantial leverage on both price and terms.


🏦 Economic & Financing Context

  • Bank of Canada: The policy rate sits at 2.3%, with the Prime Rate at 4.5%.

  • Mortgage Rates: Fixed rates are holding steady, with 5-year rates at 6.09% and 3-year rates at 6.05%.

  • Economic Headwinds: GDP growth was flat-to-negative (–0.6%) in Q4 2025, and Toronto's unemployment rate has reached 8.1%. This economic cooling is acting as a natural brake on rapid price appreciation.


🔄 What this means for you?

For Buyers: You are in a rare position for a Toronto spring. Typically, inventory dries up by April, but with 4.9 months of supply, you have time to be picky. Average prices are down nearly $55,000 from last April, making this one of the most accessible spring markets in years.

For Sellers: Competition is high—not just from other sellers, but from the sheer volume of active listings (over 25,000 across the GTA). To stand out, your property must be priced sharply and presented perfectly. Buyers have "ample choice," so they will naturally gravitate toward the best value.


🔮 Quick Verdict

SegmentMarket Condition (April 2026)
Condos

Buyer-Leaning (High Choice)

Detached (GTA)

Balanced

Durham Region

Balanced (3.5 MOI)

City of Toronto

Buyer-Leaning (4.9 MOI)

Overall GTA Market

Balanced (4.9 MOI Trend)


📞 Get our family working for yours

The market has shifted gears. We’ve moved from a quiet winter into a fast-paced spring where inventory is the primary challenge. Whether you’re looking to capitalize on lower year-over-year prices or want to list while competition is low, we have the tailored strategy you need.

👉 Contact us today to navigate the spring market with confidence.

CONTACT THE JSA TEAM


📌 Supporting Sources

Read

Toronto & GTA Real Estate Market Insights: May 2024 Market Recap

Greetings, GTA homebuyers and sellers! As we step into June, it's time to reflect on the dynamic real estate landscape that unfolded throughout May 2024. Join us as we uncover the latest insights and trends from the past month, offering a clear perspective on what May's market stats mean for your real estate journey. At Jim Stanton & Associates, our commitment to providing you with valuable information remains steadfast. Let's explore together the opportunities and possibilities that await in the ever-evolving GTA market.

Market Summary: In May 2024, the GTA real estate market showed mixed signals:

  • Sales Momentum: Compared to the same period last year, sales decreased by 21.7%. There was a month-over-month decrease of 1.42%.

  • Listing Dynamics: New listings were up 21.1% from 2023 and 9.9% month-over-month.

  • Active Listings: Active listings saw a significant increase, up 83.3% from 2023 and 20.3% from April 2024.

  • Price Trends: The average price for homes was down 2.5% year-over-year but saw a slight increase of 0.8% month-over-month.

  • Balanced Market: With 3 months of inventory available, the market was balanced.

  • Time to Sell: Days on Market remained stable month-over-month.

Click here to view the TRREB Market Watch Report for May 2024

What's happening? Toronto Market Insights

Interest Rates

On June 5th, the Bank of Canada decreased its policy interest rate by 25 basis points. This is the first move since July 2023 and the first reduction since it began increasing the rate in March 2022 from its record low of 0.25%. The last time interest rates were lowered by the Bank of Canada was when the Bank dropped rates to an all-time low at the onset of the pandemic in March 2023.

What Does This Mean for Buyers and Sellers?

For Buyers:

Buyers are poised to benefit from the recent interest rate reduction, which is expected to increase buying power and push more buyers into the market. As a general rule of thumb, a ¼ point decrease in interest rates adds about $10,000 to the average borrower's buying power, though this depends on individual circumstances. However, with more buying power, competition is likely to heat up, especially for entry-level homes. Lower rates can be tempting, but remember that while waiting for further reductions, competition will likely increase. If you buy now, you pay today's prices and can always refinance at a lower rate later. Waiting might get you a lower rate, but you'll likely be paying a higher price.

For Sellers:

Luxury homes have been taking longer to sell in the higher interest rate environment. Hang in there; lower rates may bring more buyers. Expect competition to increase even more on entry-level homes like townhomes and links. These homes are always in demand, and these changes will only spur more competition. With rates finally starting to come down, now is the time to plan your next move. Information is power, and you only benefit by starting the process now.

Conclusion:

In conclusion, May 2024 witnessed a mix of trends in the GTA real estate market, presenting a balanced environment for both buyers and sellers alike. Despite fluctuations in sales compared to last year, there was a notable month-over-month decrease. The surge in new and active listings indicates a healthy influx of properties, while pricing trends remained relatively stable. With inventory levels maintaining a balance, the market is poised for potential changes depending on the upcoming interest rate adjustments. Looking ahead, proactive engagement will be key for both buyers and sellers to capitalize on emerging opportunities. At Jim Stanton & Associates, we're dedicated to providing the guidance and support necessary for navigating this dynamic landscape effectively.

Get the Help You Need:

Regardless of the statistics and the market, you have your own reasons for making a move. A big life event, ambitions, the need to upsize or downsize, or even relocate. The key is to ensure you have someone in your corner representing your best interests. Let us be your guide. Contact Us Today!

Call Ben at 905-995-3372

Read

GTA Real Estate Market Insights: May 2024 Market Recap

Greetings, GTA homebuyers and sellers! As we step into June, it's time to reflect on the dynamic real estate landscape that unfolded throughout May 2024. Join us as we uncover the latest insights and trends from the past month, offering a clear perspective on what May's market stats mean for your real estate journey. At Jim Stanton & Associates, our commitment to providing you with valuable information remains steadfast. Let's explore together the opportunities and possibilities that await in the ever-evolving GTA market.

Market Summary: In May 2024, the GTA real estate market showed mixed signals:

  • Sales Momentum: Compared to the same period last year, sales decreased by 21.7%. There was a month-over-month decrease of 1.42%.

  • Listing Dynamics: New listings were up 21.1% from 2023 and 9.9% month-over-month.

  • Active Listings: Active listings saw a significant increase, up 83.3% from 2023 and 20.3% from April 2024.

  • Price Trends: The average price for homes was down 2.5% year-over-year but saw a slight increase of 0.8% month-over-month.

  • Balanced Market: With 3 months of inventory available, the market was balanced.

  • Time to Sell: Days on Market remained stable month-over-month.

Click here to view the TRREB Market Watch Report for May 2024

What's happening locally? Durham & Toronto Market Insights

Every city/town is unique as are the communities within them. Scroll through to find your town.

Interest Rates

On June 5th, the Bank of Canada decreased its policy interest rate by 25 basis points. This is the first move since July 2023 and the first reduction since it began increasing the rate in March 2022 from its record low of 0.25%. The last time interest rates were lowered by the Bank of Canada was when the Bank dropped rates to an all-time low at the onset of the pandemic in March 2023.

What Does This Mean for Buyers and Sellers?

For Buyers:

Buyers are poised to benefit from the recent interest rate reduction, which is expected to increase buying power and push more buyers into the market. As a general rule of thumb, a ¼ point decrease in interest rates adds about $10,000 to the average borrower's buying power, though this depends on individual circumstances. However, with more buying power, competition is likely to heat up, especially for entry-level homes. Lower rates can be tempting, but remember that while waiting for further reductions, competition will likely increase. If you buy now, you pay today's prices and can always refinance at a lower rate later. Waiting might get you a lower rate, but you'll likely be paying a higher price.

For Sellers:

Luxury homes have been taking longer to sell in the higher interest rate environment. Hang in there; lower rates may bring more buyers. Expect competition to increase even more on entry-level homes like townhomes and links. These homes are always in demand, and these changes will only spur more competition. With rates finally starting to come down, now is the time to plan your next move. Information is power, and you only benefit by starting the process now.

Conclusion:

In conclusion, May 2024 witnessed a mix of trends in the GTA real estate market, presenting a balanced environment for both buyers and sellers alike. Despite fluctuations in sales compared to last year, there was a notable month-over-month decrease. The surge in new and active listings indicates a healthy influx of properties, while pricing trends remained relatively stable. With inventory levels maintaining a balance, the market is poised for potential changes depending on the upcoming interest rate adjustments. Looking ahead, proactive engagement will be key for both buyers and sellers to capitalize on emerging opportunities. At Jim Stanton & Associates, we're dedicated to providing the guidance and support necessary for navigating this dynamic landscape effectively.

Get the Help You Need:

Regardless of the statistics and the market, you have your own reasons for making a move. A big life event, ambitions, the need to upsize or downsize, or even relocate. The key is to ensure you have someone in your corner representing your best interests. Let us be your guide. Contact Us Today!

Call Jim at 905-409-9967

MORE MARKET INSIGHTS (Markham/Stouffville & Port Hope/Cobourg)

Read

February 2024 GTA Real Estate Market Update

Greetings, GTA homebuyers and sellers! As we step into March 2024, the real estate market continues to paint an exciting picture of growth and opportunity. At Jim Stanton & Associates, we're dedicated to providing you with the latest insights to help you make informed decisions in this dynamic environment. Let's delve into the numbers and what they mean for you.

Market Summary

In February 2024, the GTA real estate market witnessed notable shifts:

  • Sales Momentum: Compared to the same period last year, sales surged by an impressive 17.9%. Additionally, there was a significant month-over-month increase of 32%.
  • Listing Dynamics: New listings experienced a substantial uptick, with a year-over-year increase of 33.5% and a noteworthy month-over-month rise of 37%.
  • Price Trends: The average price demonstrated steady growth, with a 1.1% increase compared to last year and a substantial jump of almost 9% from the previous month.
  • Seller's Advantage: With 1.98 months of inventory available, sellers continued to enjoy favorable conditions in the market.

What's happening locally? Durham & Toronto Market Insights

Every city/town is unique as are the communities within them. Scroll through to find your town


February 2024 Market Stats Durham


February 2024 Market Stats Toronto

What Does This Mean for Buyers and Sellers?

For Buyers:

In a landscape where competition is heating up, but inventory is also rising (just not outpacing sales any longer). preparation is key. To capitalize on opportunities, buyers should:

  • Financial Readiness:  Ensure your finances are in order and work with a reputable lender who can provide guidance and support throughout the buying process.
  • Offer Strategy:  Familiarize yourself with different offer processes, including the Open Offer Process, to navigate negotiations effectively.
  • Market Value Analysis:  Gain insights into how list prices are determined and understand the true market value of a property to make informed decisions.

Opportunity Awaits:

With increasing inventory and the promise of even more homes hitting the market in the spring, now is an opportune time for buyers who are ready to make their move. By staying informed and prepared, buyers can navigate the competitive landscape with confidence and find the perfect home to suit their needs.

For Sellers:

While the market is currently favoring sellers, it's important to note that nothing is guaranteed. With the significant increase in new listings—up by 33.5% year-over-year and 37% month-over-month—buyers now have more options available to them. Consequently, not every home will attract multiple offers.

To position your home for success in this competitive landscape, focus on:

  • Accurate Pricing:  Ensure your home is priced competitively to attract the attention of potential buyers and encourage multiple offers.
  • Strategic Presentation:  Invest in staging and presenting your home in its best light to captivate buyers' attention and maximize its appeal.
  • Effective Marketing:  Work with a skilled real estate team, like Jim Stanton & Associates, to implement targeted marketing strategies that reach the right audience and generate interest in your property.

By prioritizing these key factors, you can increase the likelihood of receiving multiple offers and securing the highest and best price for your home.

Get the Help You Need:

At Jim Stanton & Associates, we're here to provide guidance and support tailored to your unique needs. Our team is dedicated to offering personalized assistance in preparing, pricing, and promoting your home based on current market dynamics. Let us be your trusted partners as you navigate the exciting journey of buying or selling real estate in the GTA.

Conclusion:

As we navigate the dynamic GTA real estate market, it's evident that opportunities abound for both buyers and sellers alike. With informed decisions and strategic guidance, you can make the most of these opportunities and achieve your real estate objectives. Reach out to Jim Stanton & Associates today, and let's embark on this journey together, ensuring your success every step of the way.

Contact US

MORE MARKET INSIGHTS (add stats for Markham/Stouffville & Port Hope/Cobourg)

February 2024 Market Stats Markham and Stouffville


February 2024 Market Stats Port Hope and Cobourg

Read
Categories:   2022 | 2023 | 2024 | 2024 Real Estate Market | 2024 Year in Review | 2025 | 2025 Real Estate forecast | 2025 real estate predictions | 2026 | 2026 Real Estate Forecast | Ajax Real Estate | Amberlea, Pickering Real Estate | Annex, Toronto C02 Real Estate | Anti-Flipping Tax | APSLEY Real Estate | Apsley, North Kawartha Real Estate | attractions | back to school | Bank of Canada | Bay Ridges, Pickering Real Estate | bayview mills | Bendale, Toronto E09 Real Estate | Benjamin Tal | best lawn fertilizer | best weed killer | Blue Grass Meadows, Whitby Real Estate | Bowmanville Real Estate | Bowmanville, Clarington Real Estate | Bridle Path-Sunnybrook-York Mills, Toronto C12 Real Estate | Bridle Path-Sunnybrook-York Mills, Toronto Real Estate | Brooklin, Whitby Real Estate | buy first or sell first | Buy or Sell First | buyers | buying a home | C12 | Canada Economy | Centennial, Oshawa Real Estate | Central Oshawa Go Train Station | Central West, Ajax Real Estate | Central, Oshawa Real Estate | Chandos, North Kawartha Real Estate | Christmas | Christmas Markets | CIBC | City Centre, Mississauga Real Estate | City of Oshawa | Clarington Real Estate | Clarington, Durham Real Estate | clean gutters | clean gutters and downspouts | cleaning your deck | comparable homes | comparable sales | comparative market evaluation | Condo Townhome | corn gluten | corn gluten meal | coronavirus | Courtice, Clarington Real Estate | covid-19 | covid-19, coronavirus | credit card rate cuts, mortgage payment deferrals, COVID-19, coronavirus | curb appeal | December 2023 Market Update | deck | Donevan, Oshawa Real Estate | downspouts | Downtown Whitby, Whitby Real Estate | drainage | Durham | Durham Region | durham region home sales | durham region tourism | Fall Market | farms in durham | February 2023 | February 2024 | fertilizer | financing | Foreign Buyer Ban | Galway-Cavendish and Harvey Real Estate | gardens | Go Train | Go Transit | government of ontario | GTA | GTA Real Estate Stats | gutter | gutter guards | gutter maintenance | gutters | Highlands East Real Estate | Holiday Markets | Holiday Season | home maintenance | Housing Forecast | interest rates | Ipsos | January 2023 | January 2026 Real Estate Market | July 2023 | June 2023 | June 2026 Market Snapshot | Lakeshore East Go Train Expansion | Lakeview, Oshawa Real Estate | lawn | lawn and garden | lawn care | leak prevention | Little Lake, Cramahe Real Estate | Local | local artisans | lush green lawn | Lynde Creek, Whitby Real Estate | Maker Markets | March 2023 | March 2025 | market | market evaluation | Market Outlook | market snapshot | Market Stats | market update | market watch | May 2023 | May 2024 | May 2025 Market Snapshot | McLaughlin, Oshawa Real Estate | mortgage | mortgage rates | Mother's Day | New Development in Central Oshawa | Newcastle, Clarington Real Estate | Newtonbrook East, Toronto C14 Real Estate | North Kawartha Real Estate | north york real estate | Northglen, Oshawa Real Estate | Northwest Ajax, Ajax Real Estate | October 2023 | ontario | ontario government | Open Offer Process | oshawa | Oshawa Real Estate | oshawa botanical garden | Oshawa Go | Oshawa Real Estate | Oshawa, Durham Real Estate | Parade | parenting | parks | peony festivael | pick your own strawberries | Picks & Giggles | Pinecrest, Oshawa Real Estate | Port Whitby, Whitby Real Estate | price my home | Pringle Creek, Whitby Real Estate | re-open | real estate legislation | Real Estate Market | Real Estate Market Stats | Real Estate Statistics | real estate stats | Real Estate Trends | Redevelopment in Durham Region | ReMax | Remembrance Day | Residential Commercial Development in Oshawa | ribfest | Rolling Acres, Whitby Real Estate | Rouge E10, Toronto E10 Real Estate | Rural Cramahe, Cramahe Real Estate | Rural North Kawartha, North Kawartha Real Estate | Rural Whitby, Whitby Real Estate | sales forecast | Samac, Oshawa Real Estate | Santa | Santa Claus | Santa Claus Parade | school | September 2023 | site seeing | social distancing | South East, Ajax Real Estate | South West, Ajax Real Estate | spring cleaning | spring market | st andrews | strawberries | summer events | summer home maintenance | Toronto | Toronto C10 Real Estate | Toronto E10 Real Estate | Toronto real estate | Toronto Regional Real Estate Board | Toronto Vacant Home Tax | Toronto W09 Real Estate | Trent Lakes Real Estate | TRESA | TRREB | TRREB Stats | Trust in Real Estate Services Act | week killer | Whitby Real Estate | Williamsburg, Whitby Real Estate | windfields | York Mills | Zoocasa
This website may only be used by consumers that have a bona fide interest in the purchase, sale, or lease of real estate of the type being offered via the website. The data relating to real estate on this website comes in part from the MLS® Reciprocity program of the PropTx MLS®. The data is deemed reliable but is not guaranteed to be accurate.