RSS

The GTA Housing Market This October: What’s Actually Happening?

October brought a subtle shift across the Greater Toronto Area. While persistent economic uncertainty, high fixed mortgage rates, and the Bank of Canada’s recent 25-basis-point rate hike to 2.50% kept a chunk of prospective buyers cautious, the real story this fall is happening on the supply side.

New listings dropped by 11.9% year-over-year (and down 14.1% month-over-month), steadily draining active inventory. This pullback in supply prevented standing inventory from flooding the market and helped firm up average selling prices across the region compared to late summer.

October at a Glance: The Key Numbers (All TRREB Areas)

  • Average Selling Price: $1,024,108 (-2.7% YoY | +1.8% MoM)

  • Total Sales: 5,603 (-7.9% YoY | +11.2% MoM)

  • New Listings: 14,173 (-11.9% YoY | -14.1% MoM)

  • Active Listings: 25,098 (-10.0% YoY | -4.0% MoM)

  • Average Time on Market: 31 Listing Days (LDOM) / 49 Property Days (PDOM)

  • Average Sale-to-List Price Ratio: 97%

  • Months of Inventory: 4.48 Months (Balanced Market)

Macro Economic & Rate Context

  • Bank of Canada Move: On October 28, the Bank of Canada bumped its overnight rate up by 25 bps to 2.50%, pushing prime rates to 4.50% and lowest variable mortgage rates to around 3.70%.

  • Fixed Mortgage Rates: Tracked stickier government bond yields, holding firm in the 5.49% to 6.19% range.

  • Inflation & Growth: The rate bump was triggered by core inflation sitting at 3.1% in September and strong Q2 GDP growth (3.3%), signaling that policy rate cuts remain on pause for now.

  • Consumer Sentiment: Trade tensions and employment uncertainty continued to induce buyer hesitation, though lower selling prices compared to 2023/2024 peak levels have helped keep monthly mortgage payments manageable.

Property Type Breakdown across TRREB

  • Detached Homes: Recorded 2,693 sales (-6.2% YoY) with an average price of $1,310,627 (-3.2% YoY).

  • Semi-Detached Homes: Totaled 546 sales (-8.1% YoY) with an average selling price of $1,024,907 (-0.8% YoY).

  • Townhouses: Posted 508 sales (-11.0% YoY) at an average price of $905,385 (-5.0% YoY).

  • Condo Apartments: Saw 1,385 sales (-10.4% YoY) with an average selling price of $621,400 (-5.8% YoY).

Inside the Regions: Toronto vs. Durham Region

City of Toronto (416)

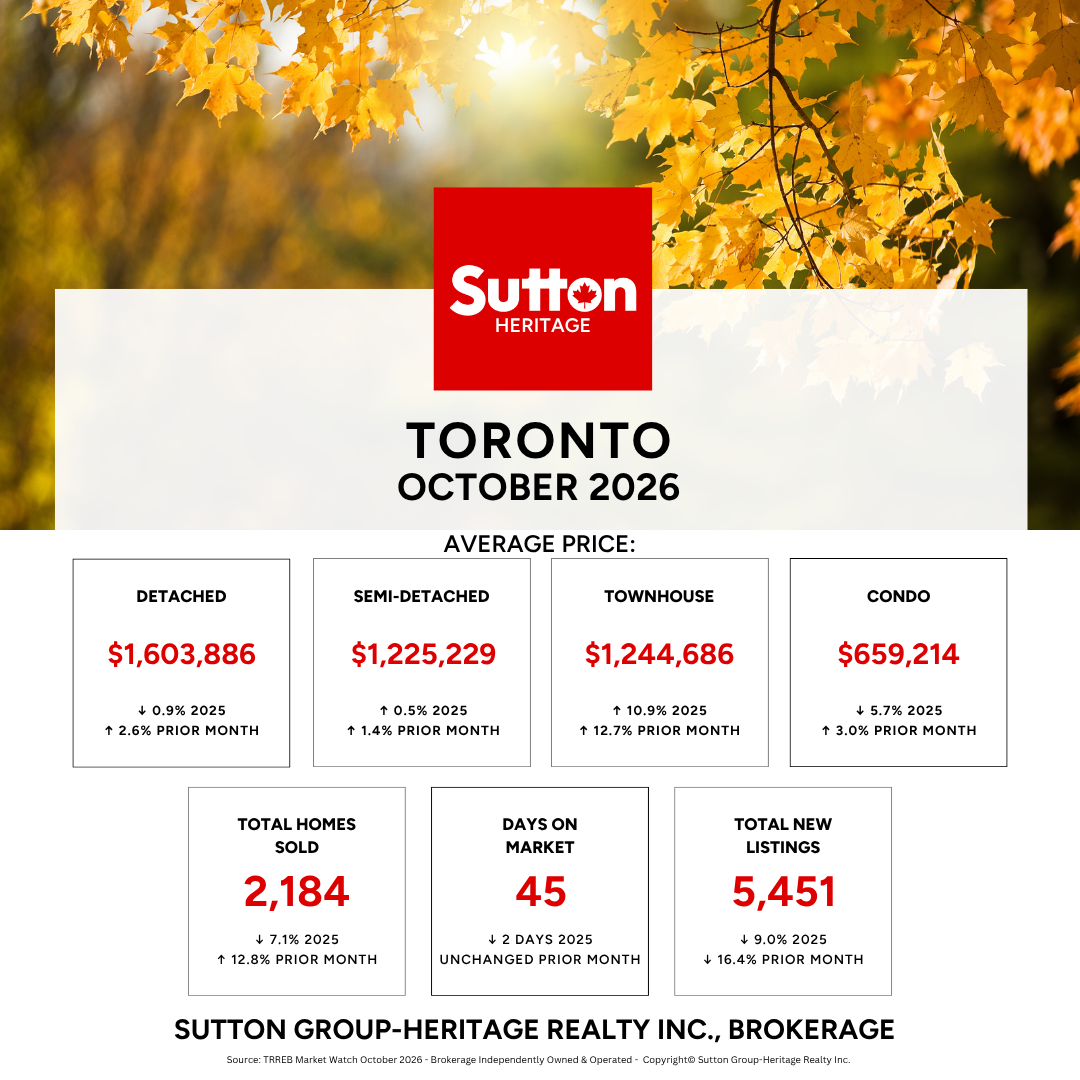
Toronto proper demonstrated strong month-over-month price momentum across almost all property types, bolstered by a sharp 16.4% drop in new listings MoM.

  • Total Sales: 2,184 (-7.1% YoY | +12.8% MoM)

  • Average Price: $1,075,627

  • Detached: $1,603,886 (-0.9% YoY | +2.6% MoM)

  • Semi-Detached: $1,225,229 (+0.5% YoY | +1.4% MoM)

  • Townhouse: $1,244,686 (+10.9% YoY | +12.7% MoM) — The standout performer in the 416 core.

  • Condo Apartment: $659,214 (-5.7% YoY | +3.0% MoM)

  • Days on Market: 45 Property Days

Durham Region (905)

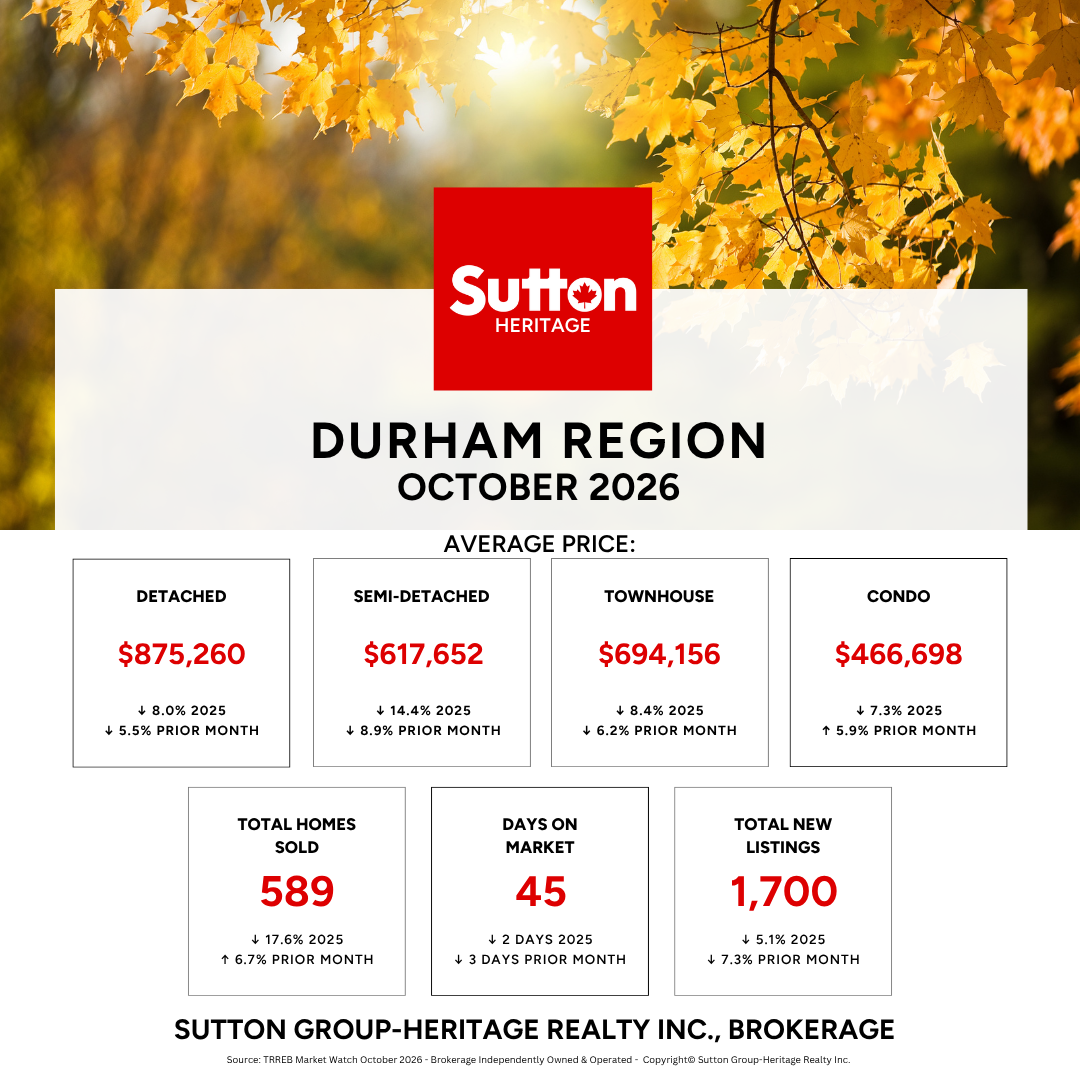
Durham Region offered accessible pricing points for buyers, though freehold values experienced modest softening month-over-month.

  • Total Sales: 589 (-17.6% YoY | +6.7% MoM)

  • Average Price: $793,024

  • Detached: $875,260 (-8.0% YoY | -5.5% MoM)

  • Semi-Detached: $617,652 (-14.4% YoY | -8.9% MoM)

  • Townhouse: $694,156 (-8.4% YoY | -6.2% MoM)

  • Condo Apartment: $466,698 (-7.3% YoY | +5.9% MoM)

  • Days on Market: 45 Property Days

What Does This Mean for You Heading Into Year-End?

For Buyers: Substantial Negotiating Power

  • Leverage in Negotiations: With average sale-to-list price ratios holding at 97%–98% and homes averaging 45 to 49 property days on market, buyers have room to include conditions and negotiate terms.

  • Price Floor Stability: Active inventory is down 10% year-over-year, meaning prices are stabilizing rather than plummeting. If you're waiting for a drastic price crash before entering the market, current inventory trends suggest prices are holding steady.

For Sellers: Strategic Pricing is Essential

  • Compete on Presentation & Price: Shrinking active inventory provides support against steep price drops, but elevated days on market mean buyers are taking their time.

  • Realistic Alignment: Properties priced at current fair market value are moving smoothly, whereas over-priced listings are sitting and requiring price adjustments.

Looking Ahead to Q4

As we move toward the final weeks of 2026, the GTA market is settling into a balanced state. Supply contraction is keeping prices grounded around the $1.00M–$1.02M mark, while elevated mortgage rates prevent a sudden surge in buyer frenzy. Expect steady, measured activity heading into the winter months.

Need Strategy, Not Guesswork?

Whether you’re planning your next move in Toronto, Durham Region, or across the GTA, having a localized strategy makes all the difference. Reach out today for a personalized consultation!

Get the complete view on markets in Durham, Markham/Stouffville and Port Hope/Cobourg.

Read

The GTA Housing Market This September: What's Actually Happening?

If you’ve been watching the Toronto and Durham real estate markets, you might be wondering why the news feels full of mixed signals. Headline numbers talk about sales dipping, while on the ground, buyers and sellers are navigating a market shaped by changing mortgage dynamics, seasonal inventory surges, and economic holding patterns.

Let's break down what actually happened across the Greater Toronto Area, Toronto, and Durham Region in September 2026, and what it means for your next move.

The Big Picture across the GTA

Across the entire Toronto Regional Real Estate Board (TRREB) area, September showed a market where buyers remained cautious amidst borrowing cost uncertainty, while sellers adjusted to early autumn expectations:

  • Total Sales: 5,040 (-9.0% YoY)

  • Average Selling Price: $1,006,409 (-5.1% YoY)

  • New Listings: 16,500 (-14.4% YoY)

  • Active Listings: 26,131 (-9.3% YoY)

  • Days on Market (Avg. LDOM): 34 days

  • Property Days on Market (Avg. PDOM): 51 days

  • Sales-to-List Price Ratio: 98%

While overall sales slowed compared to last September, supply also contracted, keeping inventory from over-accumulating and keeping negotiation room grounded around 98% of list price.

City of Toronto Market Breakdown

Toronto saw a classic post-Labour Day influx of new listings alongside a notable uptick in month-over-month sales activity.

Key Toronto Insights

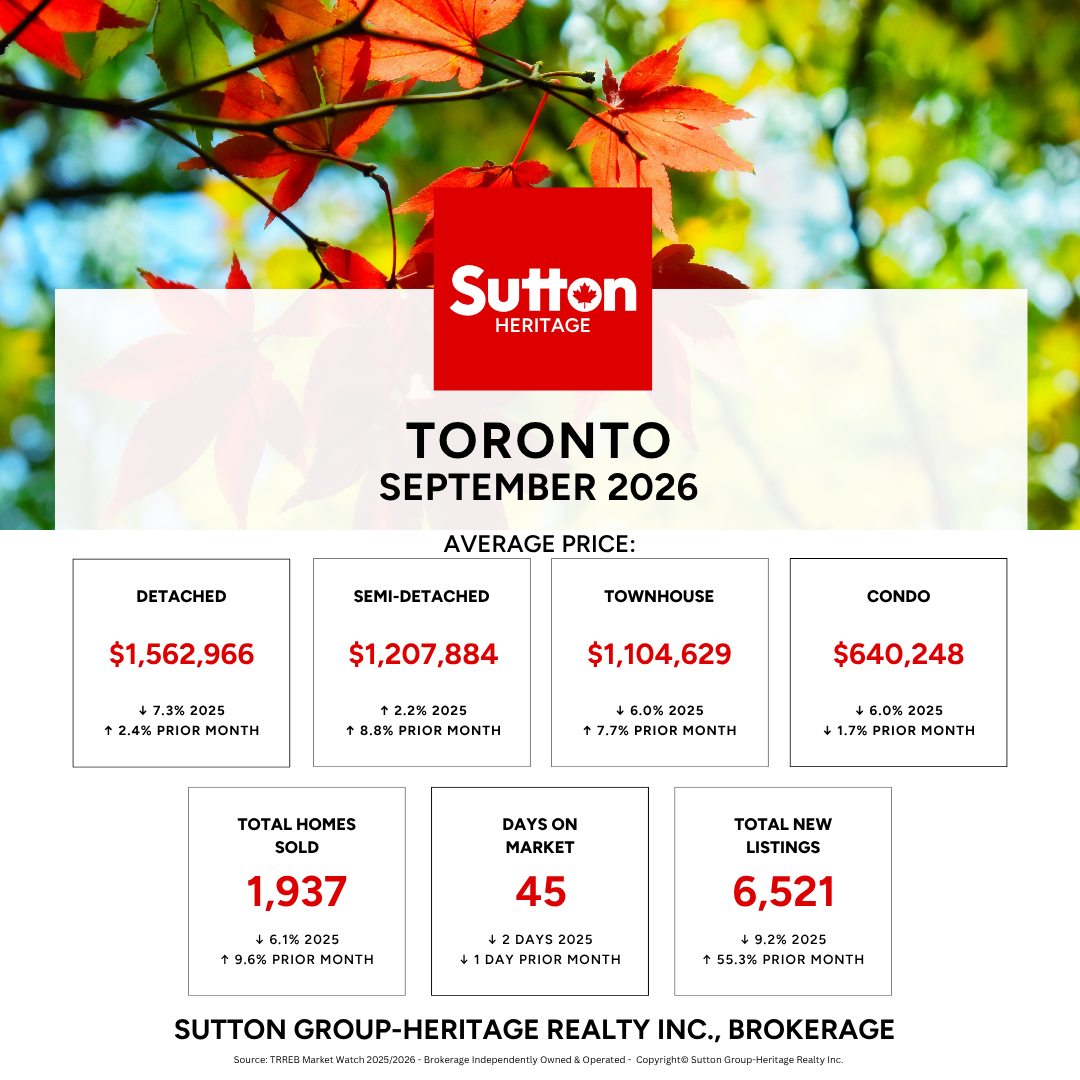
  • Freehold Demand Bounced Back Month-over-Month: Semi-detached homes ($1,207,884) and townhouses ($1,104,629) posted strong month-over-month price growth of +8.8% and +7.7% respectively, demonstrating sustained buyer demand for mid-tier freehold options.

  • Fall Inventory Arrived: New listings surged +55.3% from August to 6,521 homes, offering buyers significantly more choice than in the summer months.

  • Condos Remain Soft: Condo average prices dipped slightly month-over-month (-1.7%) to $640,248 as higher inventory levels in the condo sector gave buyers the upper hand during negotiations.

Durham Region Market Breakdown

Durham Region continued to offer an appealing blend of relative affordability and community appeal, though seasonal shifts were clearly evident.

Key Durham Insights

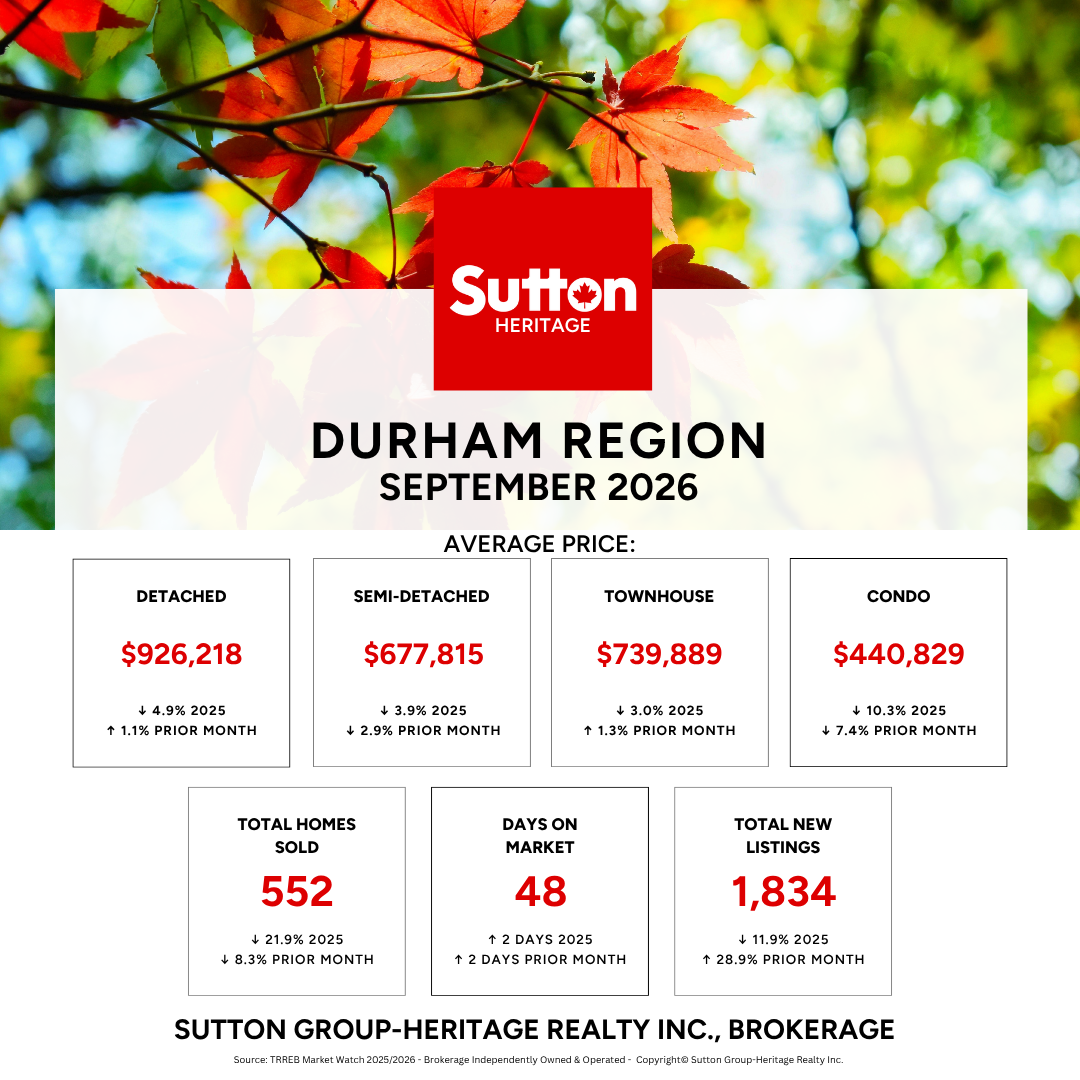
  • Detached & Townhouse Resilience: Single-family detached homes ($926,218) and townhouses ($739,889) both saw modest price increases month-over-month (+1.1% and +1.3%), reflecting steady family-home demand across Ajax, Whitby, Oshawa, and Pickering.

  • Slower Pace of Sales: Total sales dropped -8.3% month-over-month to 552 units, while Days on Market ticked up to 48 days, giving buyers extra room to inspect properties and finalize financing without feeling rushed.

  • Condo Opportunity: Condo apartment prices in Durham dropped to $440,829 (-7.4% MoM), creating an accessible entry point for first-time buyers looking to get onto the property ladder.

Behind the Numbers: Interest Rates & Mortgage Dynamics

Heading into October, borrowing dynamics played a major role in buyer behavior:

  1. The Fixed vs. Variable Gap: While the Bank of Canada held its overnight policy rate steady at 2.25% in its early September announcement, 5-year fixed mortgage rates edged upward due to rising bond yields. Variable rate options remained lower, creating a wider-than-usual rate spread and forcing buyers to choose between fixed stability or lower initial variable payments.

  2. Pent-Up Demand in a Holding Pattern: Many prospective buyers are sitting on pre-approvals, waiting for inflation trends and rate expectations to settle before locking into longer-term financing.

  3. Strategic Pricing Matters: With new listings up significantly from August (+55.3% in Toronto, +28.9% in Durham), sellers who price accurately based on recent local comps are securing firm sales, while over-priced listings are sitting past the 40-to-50-day mark.

What This Means for You

  • For Buyers: Fall inventory is here. With properties taking an average of 45 to 48 days to sell and sale-to-list price ratios holding near 98%, you have time to perform due diligence, negotiate terms, and explore mortgage structure options without pressure.

  • For Sellers: Buyers are active but price-sensitive. Proper presentation, aggressive market positioning, and realistic pricing strategies are key to standing out among the expanding fall competition.

Have questions about what these numbers mean for your neighbourhood or specific street? Contact our team today for a tailored evaluation of your home!

Read

🏡 May 2026 GTA Real Estate Market Update

The spring market accelerated in May as home sales rose 6.3% year-over-year. However, with new listings dropping sharply by nearly 19%, available winter inventory is being steadily absorbed, gradually shifting competition back into several GTA neighborhoods.

🔍 By the Numbers: May at a Glance

  • Total Sales: 6,583 (+6.3% YoY, +10.7% MoM seasonally adjusted)

  • Average Selling Price: $1,069,700 (–4.6% YoY, +1.7% MoM unadjusted)

  • Active Listings: 26,927 (–13.3% YoY)

  • New Listings: 17,698 (–18.9% YoY)

  • Days on Market:

    • Property DOM (PDOM): 42 days

    • Listing DOM (LDOM): 27 days

  • Months of Inventory (Trend): 4.8 months — Market tracks as BALANCED, but tightening monthly.

🧠 Top Takeaway

We are witnessing a persistent story of absorption. For the third consecutive month, GTA home sales outperformed last year’s figures. Because new supply plummeted by nearly 19% annually, existing standing inventory is thinning out. While average prices are still lower than they were in the spring of 2025, the month-over-month price bump shows that local competition is steadily returning.

What's happening locally? Durham Region & Toronto Insights

The suburban-urban divide continues to control individual market paces, creating distinct conditions depending on where you look.

🏘 Segment Performance

Detached Homes

  • Total Sales: 3,236 (+7.9% YoY)

  • Average Price: $1,358,131 (–4.7% YoY)

  • Market Status: Balanced. Detached properties saw the most active demand in May, specifically concentrated in the $1M to $1.5M price range.

Condo Apartments

  • Total Sales: 1,535 (+3.6% YoY)

  • Average Price: $639,468 (–6.4% YoY)

  • Market Status: Buyer-Leaning. Though condo demand has stabilized and stopped deteriorating, it remains the segment facing the heaviest annual price discounts.

Durham Region

  • Total Sales: 804 | New Listings: 1,978

  • Average Price: $851,065

  • Market Status: Balanced. Durham continues to represent the most price-accessible suburban alternative in the 905, maintaining steady absorption without hitting frantic price spikes.

City of Toronto (416)

  • Total Sales: 2,377 (+3.2% YoY)

  • Average Price: $1,108,292

  • Market Status: Balanced / Buyer-Leaning. Toronto proper remains highly active, but the large volume of existing options still guarantees substantial buyer leverage.

🏦 Economic & Financing Context

  • Bank of Canada Interest Rate: The central bank held its policy rate steady at 2.25% (with Prime at 4.5%) in its latest announcement. Economists suggest the Bank is navigating cautiously due to weak Q1 economic growth data mixed with persistent global supply risks.

  • The Renewal Trap: The Bank of Canada recently highlighted a rising trend where falling home prices over the past year could potentially trap a subset of GTA borrowers at renewal, limiting their ability to switch lenders if their equity has thinned out.

  • Mortgage Rate Realities: Five-year fixed rates are averaging roughly 5.09-5.09%, while short-term fixed rates sit between 4.64% and 4.89%. Borrowers are prioritizing fundamental budget planning over speculating on rapid future rate cuts. Variable rates are being offered below 4%.

🔄 What this means for you?

For Buyers:

Improved affordability remains your greatest asset this season, with average prices still sitting roughly $50,000 below last year's benchmarks. However, do not expect listings to linger indefinitely. Standing inventory fell 13.3% annually, meaning the "buyer's paradise" of endless choice is transitioning into a standard, balanced environment.

For Sellers:

The reduction in new supply (–18.9% YoY) works heavily in your favor. You are competing with far fewer newly listed homes than sellers did last spring. While aggressive overpricing will still leave a property sitting for over a month, accurate market pricing is yielding solid, efficient sales as buyer demand trends upward.

🔮 Quick Verdict

SegmentMarket Condition (May 2026)
CondosBuyer-Leaning (Great Entry Point)
Detached (GTA)Balanced (Highly Active)
Durham RegionBalanced (Steady & Accessible)
City of TorontoBalanced / Buyer-Leaning
Overall GTA MarketBalanced (4.8 MOI Trend)

📞 Get our family working for yours

The spring market has hit its peak, and inventory is moving. Successfully making a move right now relies entirely on understanding micro-local data—because a condo in Toronto demands a completely different strategy than a detached home in Durham. Let our experience guide your next transition.

👉 Contact us today to build your real estate strategy.

CONTACT THE JSA TEAM

📌 Supporting Sources

Read

🏡 March 2026 GTA Real Estate Market Update

Spring is stirring: March home sales jumped over 30% from February as buyers moved to capitalize on improved affordability and significant negotiating power before the market tightens further.


🔍 By the Numbers: March at a Glance

  • Total Sales: 5,039 (+1.7% YoY, +30.27% MoM)

  • Average Selling Price: $1,017,796 (–6.7% YoY, +0.9% MoM)

  • Active Listings: 21,596 (–8.0% YoY, +11.8% MoM)

  • New Listings: 14,442 (–16.7% YoY)

  • Sales-to-New Listings Ratio: 35% (Up from 29% last year)

  • Days on Market:

    • Property DOM: 47 days (Down 13% from February)

    • Listing DOM: 31 days

  • Months of Inventory: 4.29 months — Market remains BALANCED.


🧠 Top Takeaway

The "Spring Surge" has arrived, but with a twist. While sales volume skyrocketed 30% month-over-month, new listings fell nearly 17% compared to last year. This tightening of supply means that while buyers still enjoy negotiating power today, the window of "flat" pricing may be closing as we move deeper into 2026.


What's happening locally? Durham Region Market Insights

While the broader GTA sits in balanced territory, local pockets like Durham are showing signs of a much faster recovery.


🏘 Segment Performance

Condos

  • ~ 28.2% of total sales

  • Average Price: $620,479

  • 5.4 months of supply → Remains a Firm Buyer’s Market, though inventory is being absorbed faster as new listings fail to keep pace with sales.

Detached Homes

  • ~ 44.4% of total sales

  • Average Price: $1,342,375

  • 4.17 months of supply → Balanced Market.

Durham Region

  • 392 Sales | Average Price: $850,304

  • 2.96 months of inventory → Inventory has dipped below the 3-month mark, a strong signal for sellers. Durham continues to be the GTA's top performer for seller-favorable conditions.

City of Toronto

  • 951 Sales | 4,912 Listings

  • 5.17 months of inventory → Buyer’s Market. The 416 remains the best bet for buyers looking for maximum choice.


🏦 Economic & Financing Context

  • Bank of Canada: The policy rate was held steady at 2.25% on March 18, 2026. The next announcement is set for April 29, with markets pricing in a 96% chance of another hold.

  • Bond Market & Fixed Rates: 5-year Government of Canada bond yields are hovering near 3.06%. This has caused some fixed mortgage rates to edge slightly higher recently, making the cost of "breaking" a mortgage more expensive for some.

  • The "Renewal Crunch": A recent TD study found that 56% of homeowners are cutting discretionary spending to prepare for higher payments at renewal.

  • Stirring Demand: Despite renewal stress, 30% of prospective buyers say they are more likely to purchase before year-end, citing lower prices and rate stability as the primary "green lights".


🔄 What this means for you?

For Buyers:

The surface is beginning to bubble. While you still have "substantial negotiating power", the 16.7% drop in new listings suggests that the massive inventory selection we saw in January is starting to be absorbed. If you are one of the 75% of buyers currently saving for a down payment, now is the time to finalize your pre-approval before the "missing middle" supply tightens further.

For Sellers:

Inventory in the GTA is currently 8% lower than last year. In areas like Durham, where inventory is under 3 months, you are in a much stronger position than the "Buyer's Market" headlines suggest. With properties selling 13% faster than last month, the market is picking up speed—but correct pricing remains the bridge to a successful sale.


🔮 Quick Verdict

SegmentMarket Condition (March 2026)
CondosFirm Buyer’s Market (~5.4 MOI)
Detached (GTA)Balanced (~4.2 MOI)
Durham Region HomesBalanced / Leaning Seller (~3.0 MOI)
City of TorontoBuyer’s Market (~5.2 MOI)
Overall GTA MarketBalanced (~4.3 MOI)

📞 Get our family working for yours

The market is shifting from "wait and see" to "active and moving." A cookie-cutter approach won't work when one neighborhood is in a Buyer's Market and the next is leaning toward Sellers. If you need help navigating these tightening conditions, reach out. We tailor our strategy to meet your unique goals.

👉 Contact us today to stay ahead of the spring market curve.

CONTACT THE JSA TEAM


📌 Supporting Sources

Read

🏡 October 2025 GTA Real Estate Market Update

Buyers continue to benefit as sales soften, prices dip, and inventory stays elevated—despite improving monthly momentum.


🔍 By the Numbers: October at a Glance

  • Total Sales: 6,138 (–9.5% YoY, +9.76% MoM)

  • Average Selling Price: $1,054,372 (–7.2% YoY, –0.5% MoM)

  • New Listings: +2.7% YoY, –16.6% MoM

  • Active Listings: 27,808 (+17.2% YoY, –5.4% MoM)

  • Sales-to-New Listings Ratio: ~38%

  • Days on Market:

    • Property DOM: 50 days

    • Listing DOM: 31 days

  • Months of Inventory: 4.53 months — a balanced market favouring buyers


🧠 Top Takeaway

October continued a trend of improved month-over-month sales, but high supply and softening prices create ideal conditions for confident buyers to take advantage of increased affordability.


What's happening locally? Toronto Market Insights

Then what’s happening out east in Durham region. Every city/town is unique as are the communities within them. Scroll through to find your town.


🏘 Segment Performance

Condos

  • ~25.4% of sales

  • ~32% of active inventory

  • 5.7 months of supply → Firm buyer’s market
    Condo inventory remains high, keeping conditions highly negotiable for buyers, especially for 1-bedroom and micro units.

Detached Homes

  • 4.5 months of inventory

  • Moving back toward balance but still leaning buyers
    Detached homes show more stability than condos, but elevated supply continues to give buyers leverage.

Durham Region

  • 3.6 months of inventory

  • Still balanced, but slowly rising inventory is easing pressure on buyers.

City of Toronto

  • 4.53 months of inventory

  • Improved from earlier in the year but still buyer-leaning


🏦 Economic & Financing Context

  • The Bank of Canada cut its policy rate by 0.25% in October, marking another step toward improved borrowing conditions.

    • Variable-rate mortgage holders benefit immediately: for every $100,000 of mortgage debt, the latest prime rate cut translates into savings of about $14 less per month under a 25-year amortization. 

    • Fixed-payment variable mortgages (where monthly payments stay the same even if rates fall) see greater principal repayment when rates drop, boosting equity growth even if the payment doesn’t change. 

    • Home equity lines of credit (HELOCs) and personal lines of credit—both tied to prime—also see immediate interest-cost relief following the prime reduction. 

    • With roughly one-third of outstanding mortgages in Canada still variable-rate, the rate cut offers meaningful financial flexibility for a large portion of homeowners.

  • Lower borrowing costs could help offset declines in prices, slowly improving affordability—but have not yet been enough to pull hesitant buyers off the sidelines.

  • Economic uncertainty tied to global trade tensions (U.S.–China, U.S.–Canada) continues to weigh on consumer confidence and spending.


🔄 What’s Changing — and What’s Not

✅ Momentum is returning

Sales increased month-over-month as buyers reacted to lower mortgage rates.

✅ Prices continue to soften

Year-over-year declines persist, October showed the largest YoY price decline of 2025..

✅ Supply remains a powerful market force

High inventory continues to give buyers strong negotiation power despite improving sales numbers.

✅ Rate cuts help—but don’t change the fundamentals yet

Borrowing is cheaper, but broader economic uncertainty continues to hold many buyers back.


⚖️ Buyer vs. Seller Strategy

For Buyers:

  • You’re still firmly in the driver’s seat.

  • With lower rates and high inventory, take your time—but avoid trying to time the exact bottom.

  • There’s meaningful negotiating room in condos and mid-tier detached homes.

  • If you find a home that meets your needs and budget, the fundamentals favor buying now rather than waiting.

For Sellers:

  • Price strategically and realistically—do not chase the market downward.

  • Homes that are priced accurately and show well are selling; homes that aren’t are sitting.

  • Understand your local competition—especially if selling a condo or entry-level detached home.

  • Preparation, pricing, and promotion remain critical in this environment.


🔮 Quick Verdict

Segment

Market Condition

Condos

Buyer’s Market (~5.7 MOI)

Detached (GTA-wide)

Balanced → Buyer-Leaning (~4.5 MOI)

Durham Region

Balanced (~3.6 MOI)

City of Toronto

Buyer-Leaning (~4.5 MOI)

Overall GTA

Balanced → Buyer-Favoring (~4.5 MOI)

The Bottom Line:

In October, sales weren’t strong enough to combat softening prices, combined with elevated inventory and a fresh rate cut it created one of the most buyer-friendly markets we’ve seen—giving ready buyers meaningful negotiation power in a cautiously improving landscape.

Need help navigating the current market?

👉 Reach out for a personalized consultation

Read

🏡 October 2025 GTA Real Estate Market Update

Buyers continue to benefit as sales soften, prices dip, and inventory stays elevated—despite improving monthly momentum.


🔍 By the Numbers: October at a Glance

  • Total Sales: 6,138 (–9.5% YoY, +9.76% MoM)

  • Average Selling Price: $1,054,372 (–7.2% YoY, –0.5% MoM)

  • New Listings: +2.7% YoY, –16.6% MoM

  • Active Listings: 27,808 (+17.2% YoY, –5.4% MoM)

  • Sales-to-New Listings Ratio: ~38%

  • Days on Market:

    • Property DOM: 50 days

    • Listing DOM: 31 days

  • Months of Inventory: 4.53 months — a balanced market favouring buyers


🧠 Top Takeaway

October continued a trend of improved month-over-month sales, but high supply and softening prices create ideal conditions for confident buyers to take advantage of increased affordability.


What's happening locally? Durham Region Market Insights

Every city/town is unique as are the communities within them. Scroll through to find your town.


🏘 Segment Performance

Condos

  • ~25.4% of sales

  • ~32% of active inventory

  • 5.7 months of supply → Firm buyer’s market
    Condo inventory remains high, keeping conditions highly negotiable for buyers, especially for 1-bedroom and micro units.

Detached Homes

  • 4.5 months of inventory

  • Moving back toward balance but still leaning buyers
    Detached homes show more stability than condos, but elevated supply continues to give buyers leverage.

Durham Region

  • 3.6 months of inventory

  • Still balanced, but slowly rising inventory is easing pressure on buyers.

City of Toronto

  • 4.53 months of inventory

  • Improved from earlier in the year but still buyer-leaning


🏦 Economic & Financing Context

  • The Bank of Canada cut its policy rate by 0.25% in October, marking another step toward improved borrowing conditions.

    • Variable-rate mortgage holders benefit immediately: for every $100,000 of mortgage debt, the latest prime rate cut translates into savings of about $14 less per month under a 25-year amortization. 

    • Fixed-payment variable mortgages (where monthly payments stay the same even if rates fall) see greater principal repayment when rates drop, boosting equity growth even if the payment doesn’t change. 

    • Home equity lines of credit (HELOCs) and personal lines of credit—both tied to prime—also see immediate interest-cost relief following the prime reduction. 

    • With roughly one-third of outstanding mortgages in Canada still variable-rate, the rate cut offers meaningful financial flexibility for a large portion of homeowners.

  • Lower borrowing costs could help offset declines in prices, slowly improving affordability—but have not yet been enough to pull hesitant buyers off the sidelines.

  • Economic uncertainty tied to global trade tensions (U.S.–China, U.S.–Canada) continues to weigh on consumer confidence and spending.


🔄 What’s Changing — and What’s Not

✅ Momentum is returning

Sales increased month-over-month as buyers reacted to lower mortgage rates.

✅ Prices continue to soften

Year-over-year declines persist, October showed the largest YoY price decline of 2025..

✅ Supply remains a powerful market force

High inventory continues to give buyers strong negotiation power despite improving sales numbers.

✅ Rate cuts help—but don’t change the fundamentals yet

Borrowing is cheaper, but broader economic uncertainty continues to hold many buyers back.


⚖️ Buyer vs. Seller Strategy

For Buyers:

  • You’re still firmly in the driver’s seat.

  • With lower rates and high inventory, take your time—but avoid trying to time the exact bottom.

  • There’s meaningful negotiating room in condos and mid-tier detached homes.

  • If you find a home that meets your needs and budget, the fundamentals favor buying now rather than waiting.

For Sellers:

  • Price strategically and realistically—do not chase the market downward.

  • Homes that are priced accurately and show well are selling; homes that aren’t are sitting.

  • Understand your local competition—especially if selling a condo or entry-level detached home.

  • Preparation, pricing, and promotion remain critical in this environment.


🔮 Quick Verdict

Segment

Market Condition

Condos

Buyer’s Market (~5.7 MOI)

Detached (GTA-wide)

Balanced → Buyer-Leaning (~4.5 MOI)

Durham Region

Balanced (~3.6 MOI)

City of Toronto

Buyer-Leaning (~4.5 MOI)

Overall GTA

Balanced → Buyer-Favoring (~4.5 MOI)

The Bottom Line:

In October, sales weren’t strong enough to combat softening prices, combined with elevated inventory and a fresh rate cut it created one of the most buyer-friendly markets we’ve seen—giving ready buyers meaningful negotiation power in a cautiously improving landscape.

Need help navigating the current market?

👉 Reach out for a personalized consultation

Read

🏡 August 2025 GTA Real Estate Market Update Bayview Mills

Sales hold steady, prices dip, and inventory levels continue to give buyers the upper hand.


By the Numbers: September at a Glance

  • Total Sales: 5,211 (+2.3% YoY, –14.6% MoM)

  • Average Selling Price: $1,022,143 (–5.2% YoY, –2.8% MoM)

  • New Listings: Up 9.4% YoY, down 20.3% MoM

  • Active Listings: 27,495 (+22.4% YoY, –9% MoM)

  • Sales-to-New Listings Ratio: ~37%

  • Days on Market:

    • Property DOM: 41 days

    • Listing DOM: 30 days

  • Months of Inventory: ~5 months — favouring buyers


🧠 Top Takeaway:

August showed stable sales but continued price softness, with steady inventory keeping the market tilted in favour of buyers—even as demand remains consistent.


What's happening locally? Durham & Toronto Market Insights

Every city/town is unique as are the communities within them. Scroll through to find your town.


📸 Segment Snapshot

Segment

Months of Inventory

Market Insight

Condos

~6.65 months

Firmly buyer’s market

Detached Homes

~5.13 months

Leaning toward buyers

Durham Region

~3.99 months

Balanced

City of Toronto

~5.42 months

Slight buyer advantage


📉Economic & Construction Insights

  • Bank of Canada Watch: With the next rate decision on September 17, all eyes are on upcoming inflation data to guide policy direction. Opinions vary on whether the central bank will raise or cut its 2.75% rate.

  • Building Activity Slowing: New housing starts surged 4% July-over-July overall in Canada, but Ontario continues to lag. Windsor recorded 25% fewer starts in H1 2025 versus 2024—and Toronto’s figures fell dramatically.


🏠 What’s Changing — and What’s Not

  1. Affordability Still a Focus: Prices are easing YoY, but many buyers still face monthly affordability challenges—even in a more liquid market.

  2. Inventory Remains Elevated: With five months of supply, buyers have ample choice, though market activity remains measured.

  3. Construction Slowdown Looms: Decreased housing starts in Ontario may tighten future supply—an important insight for strategic buyers or long-term investors.

  4. Interest Rate Uncertainty Ahead: Inflation data due mid-September could sway BoC decisions, impacting mortgage cost expectations.


⚖️ Buyers vs. Sellers: What’s the Game Plan?

For Buyers:

  • You’ve got room to navigate—no need to rush or overpay.

  • Stay informed about rate movements ahead of the September decision.

  • Low construction today may mean fewer new choices down the road—act when ready.

For Sellers:

  • Price competitively—don’t cut too late chasing correction.

  • Professional valuation remain important

  • Let’s align your timing with market trends and local dynamics—especially in areas like Durham, where inventory remains balanced.


🔮 Quick Verdict

Market Segment

Current Condition

Condos

Buyer’s market (~6.6 months MOI)

Detached (GTA-wide)

Buyer-leaning (~5.1 months MOI)

Durham Region Homes

Balanced (~4.0 months MOI)

Overall GTA

Buyer-leaning (~5 months MOI)


📞Need a Customized Buying or Selling Strategy?

Whether you’re ready to act or just assessing, now is the time for informed moves. Let’s collaborate to create a strategy tailored to your goals and market timing.

👉 Reach out for a personalized consultation

SOURCES: TRREB, Canadian Mortgage Trends, CMP, Bank of Canada, CBC, Todayville, cmhc-schl.gc.ca, TD Economics, RBC

Read

🏡 August 2025 GTA Real Estate Market Update

Sales hold steady, prices dip, and inventory levels continue to give buyers the upper hand.


By the Numbers: September at a Glance

  • Total Sales: 5,211 (+2.3% YoY, –14.6% MoM)

  • Average Selling Price: $1,022,143 (–5.2% YoY, –2.8% MoM)

  • New Listings: Up 9.4% YoY, down 20.3% MoM

  • Active Listings: 27,495 (+22.4% YoY, –9% MoM)

  • Sales-to-New Listings Ratio: ~37%

  • Days on Market:

    • Property DOM: 41 days

    • Listing DOM: 30 days

  • Months of Inventory: ~5 months — favouring buyers


🧠 Top Takeaway:

August showed stable sales but continued price softness, with steady inventory keeping the market tilted in favour of buyers—even as demand remains consistent.


What's happening locally? Durham & Toronto Market Insights

Every city/town is unique as are the communities within them. Scroll through to find your town.


📸 Segment Snapshot

Segment

Months of Inventory

Market Insight

Condos

~6.65 months

Firmly buyer’s market

Detached Homes

~5.13 months

Leaning toward buyers

Durham Region

~3.99 months

Balanced

City of Toronto

~5.42 months

Slight buyer advantage


📉Economic & Construction Insights

  • Bank of Canada Watch: With the next rate decision on September 17, all eyes are on upcoming inflation data to guide policy direction. Opinions vary on whether the central bank will raise or cut its 2.75% rate.

  • Building Activity Slowing: New housing starts surged 4% July-over-July overall in Canada, but Ontario continues to lag. Windsor recorded 25% fewer starts in H1 2025 versus 2024—and Toronto’s figures fell dramatically.


🏠 What’s Changing — and What’s Not

  1. Affordability Still a Focus: Prices are easing YoY, but many buyers still face monthly affordability challenges—even in a more liquid market.

  2. Inventory Remains Elevated: With five months of supply, buyers have ample choice, though market activity remains measured.

  3. Construction Slowdown Looms: Decreased housing starts in Ontario may tighten future supply—an important insight for strategic buyers or long-term investors.

  4. Interest Rate Uncertainty Ahead: Inflation data due mid-September could sway BoC decisions, impacting mortgage cost expectations.


⚖️ Buyers vs. Sellers: What’s the Game Plan?

For Buyers:

  • You’ve got room to navigate—no need to rush or overpay.

  • Stay informed about rate movements ahead of the September decision.

  • Low construction today may mean fewer new choices down the road—act when ready.

For Sellers:

  • Price competitively—don’t cut too late chasing correction.

  • Professional valuation remain important

  • Let’s align your timing with market trends and local dynamics—especially in areas like Durham, where inventory remains balanced.


🔮 Quick Verdict

Market Segment

Current Condition

Condos

Buyer’s market (~6.6 months MOI)

Detached (GTA-wide)

Buyer-leaning (~5.1 months MOI)

Durham Region Homes

Balanced (~4.0 months MOI)

Overall GTA

Buyer-leaning (~5 months MOI)


📞Need a Customized Buying or Selling Strategy?

Whether you’re ready to act or just assessing, now is the time for informed moves. Let’s collaborate to create a strategy tailored to your goals and market timing.

👉 Reach out for a personalized consultation

SOURCES: TRREB, Canadian Mortgage Trends, CMP, Bank of Canada, CBC, Todayville, cmhc-schl.gc.ca, TD Economics, RBC

Read

What will happen next?: RE/MAX Outlines Where the Canadian & Durham Region Housing Market will end up in 2025

If you’re considering a move in the last half of 2025 getting expert insight into the market is a must so this post is for you.

RE/MAX has come out with their annual Fall market update. It not only recaps year-to-date for the Canadian real estate market and highlights communities like Durham Region, but it offers a prediction into what RE/MAX expects to happen by years end. 

While our team is with Sutton Group we believe information is power for our clients and the RE/MAX perspective is worth taking a look at. That said, don’t let the headlines dictate your move. Timing the market is full of potential landmines. Before making any decisions speak to an expert and get on-the-ground insights about your market and your situation. Need help? Contact us.

In the meantime lets see what RE/MAX has to say:

Canadian Real Estate Market Year-to-Date (2025)

  • Average home price (Jan 1–Jul 3): $900,089, marking a 3.7 % drop year-over-year.

  • Sales volume (Jan 1–Jul 31): 4,999 units, down 11.1 % year-over-year.

  • New listings (Jan 1–Jul 31): 13,425, a 14.4 % increase year-over-year.


What’s Ahead for the Rest of 2025

  • Average price is projected to fall 5 %, landing around $855,085 by year-end.

  • Sales are expected to decline a further 3 %.

  • This confirms a buyer’s market nationwide, with inventory climbing and demand softening.

Nationwide, RE/MAX expects the national average home price to slide by 6.5 % and sales to dip by 5 % by year-end. Inventory surges in Ontario and BC are gradually shifting these areas into buyer-favored territory.


Key Takeaways: Canada at a Glance

  1. Buyers hold the leverage. Rising inventory and falling prices give purchasers more negotiating power.

  2. Prices dipping but regionally varied. Ontario and BC see declines, while Atlantic Canada and the Prairies hold firm or even rise.

  3. Shifting buyer profile. First-time buyers now tend to be older (late 20s to 40s), many turning to family help, co-ownership, or strong savings to get in the game..

  4. Sellers adjusting. Expect more realistic pricing, strategic staging, and conditional offers as new market norms.

  5. Falling rates fuel optimism. Inventory up + affordability improving may attract cautious buyers back into the market.

Bottom line: Across Canada, the real estate market is tilting in favour of informed and prepared buyers, while sellers who align with current realities will still find success.


Focus: Durham Region

Here's how Durham Region is shaping up:

  • Avg. price (Jan 1–Jul 3): $900,089—a 3.7 % drop from last year.

  • Sales (Jan 1–Jul 31): 4,999 units, down 11.1 %.

  • Listings: 13,425, up 14.4 %.

  • Year-end forecast:

    • Price: –5 %, projecting to $855,085.

    • Sales: –3 %.

    • Market type: Firmly a buyer’s market.

Developments in late summer/early fall show continued balance:

  • Balanced market conditions, with buyers seeing more options and homes staying on market longer.

  • Inventory nearing 2009 highs, sales down sharply, homes generally selling below list price—especially in southern Durham.

  • Average September sale price: $842,615 (down 5.8 % year-over-year), with sale-to-list ratio around 98.3 %.

  • Months of inventory: About 5.6 months, indicating sufficient supply for current demand.

Durham Region Takeaway

Buyers have the upper hand—with more choices and less urgency in bidding wars. Sellers must price smart, time thoughtfully, and stand out in a crowded landscape. Proper preparation and local strategy are key for anyone looking to transact by year’s end.

Final Word:

For buyers, now is a moment of opportunity—leverage the extra inventory and negotiate smartly. Sellers? Align with the market, focus on presentation and pricing, and get the help of a seasoned agent to stand out.

GET THE HELP YOU NEED 👉 CONTACT US

SOURCES: RE/MAX Canada, Narcity, Ceros, renxhomes.ca, REMINET, Yahoo Finance, John Owen

Read

🏡 July 2025 GTA Real Estate Market Update

Don’t be fooled by the headlines. Let us give you the whole picture. Sales are heating up, but inventory remains elevated—buyers still hold the advantage.


By the Numbers: July at a Glance

  • Total Sales: 6,100 (+10.9% YoY, –2.3% MoM)

  • Average Selling Price: $1,051,719 (–5.5% YoY, –4.5% MoM)

  • New Listings: 17,613 (+5.7% YoY, –11.2% MoM)

  • Active Listings: 30,215 (+26.1% YoY, –4.4% MoM)

  • Sales-to-New Listings Ratio: ~35%

  • Days on Market:

    • Property DOM: 41 days

    • Listing DOM: 30 days

  • Months of Inventory: 4.95 months — a balanced market with a slight buyer tilt


🧠 Top Takeaway:

July delivered the strongest home sales for the month since 2021, but high inventory kept the market balanced—leaning in favour of buyers.


What's happening locally? Durham & Toronto Market Insights

Every city/town is unique as are the communities within them. Scroll through to find your town.


Segment Insights

SegmentInventory MOIMarket Condition
Condos~6.35 monthsFirm buyer’s market
Detached Homes~4.9 monthsMoving back to balance
Durham Region~3.3 monthsBalanced
City of Toronto~5.6 monthsLeaning toward buyers

📉 Economic & Rate Context

  • BoC Rate: Held at 2.75%, with global economic uncertainty and trade tensions continuing to weigh on policy decisions.

  • Macro Observations: Housing remains a key economic driver. Cuts to interest rates would support stronger sales, but affordability is gradually improving as prices soften.


🏠 What’s Changing — and What’s Not

  1. Sales Are Gaining Momentum: July sales were the most robust for the month in four years, showing renewed buyer activity.

  2. Prices Continue to Cool: Average prices are still down year-over-year, improving affordability.

  3. Inventory Remains Elevated: More listings mean choice for buyers—and leverage in negotiations.

  4. Segment Trends Differ: Condos remain strongly buyer-friendly, while demand for detached homes and suburban areas shows stability.


⚖️ Buyers vs. Sellers: Who Holds the Edge?

For Buyers:

  • Enjoy expanded choices and improved pricing—particularly in the condo market.

  • Entry-level detached homes are active, but still offer room for negotiation.

  • With possible rate cuts ahead, locking in financing sooner may be smart.

For Sellers:

  • Entry-level properties remain in demand; € ensure proper presentation and pricing.

  • Larger or luxury listings may require more time to sell—strategic marketing is essential.

  • Partner with an agent who can position your home effectively in this nuanced market.


🔮 Quick Verdict

Market SegmentCurrent Condition
CondosStrong buyer’s market (~6 months MOI)
Detached (GTA-wide)Balanced (~4.9 months MOI)
Durham RegionBalanced (~3.3 months MOI)
Overall GTALeaning toward buyers (~5 months MOI)

📞 Need Strategy, Not Guesswork?

July’s market shows more activity—but high inventory means buyers have choices and sellers must be smart. Whether you're ready to act or gathering intel, let’s collaborate and build your tailored strategy.

👉 Reach out for your personalized consultation

SOURCES:  TRREB, Zoocasa, Global News, Sotheby's Residences Group, Storeys, GlobeNewswire, GTA Chronicle

Read

🏡 May 2025 GTA Real Estate Market Update: Inventory Climbs, Market Shifts Towards Buyers

📊 Market Snapshot

  • Total Sales: 6,244 (-13.3% YoY, +11.5% MoM)

  • Average Selling Price: $1,120,879 (-4% YoY, +1.2% MoM)

  • New Listings: 21,819 (+14% YoY, +15.8% MoM)

  • Active Listings: 30,964 (+41.5% YoY, +13.1% MoM) — the highest in nearly 25 years

  • Sales-to-New Listings Ratio: 38%

  • Property Days on Market (PDOM): 39 days

  • Listing Days on Market (LDOM): 25 days

  • Months of Inventory (MOI): 4.96 — indicating a balanced market leaning towards buyers


🧠 Top Takeaway

May 2025 marked a significant shift in the GTA housing market. While sales saw a modest month-over-month increase, the surge in active listings to a 25-year high has tilted the market dynamics. With a sales-to-new listings ratio of 38% and nearly 5 months of inventory, buyers are gaining more negotiating power, especially in certain segments.

What's happening locally? Durham & Toronto Market Insights

Every city/town is unique as are the communities within them. Scroll through to find your town.


🏘️ Segment Insights

  • Condos: With over 7 months of inventory, condos, particularly 1-bedroom units, remain firmly in a buyer's market. They account for 34% of active listings.

  • Detached Homes: Representing 44% of inventory, detached homes have 4.6 months of inventory, indicating a balanced market.

  • Townhomes & Semis: These segments continue to stay balanced, offering opportunities for both buyers and sellers.

  • Regional Highlights:

    • Durham Region: Balanced market with 3.25 months of inventory.

    • City of Toronto: Leaning towards a buyer's market with 5.23 months of inventory; condo apartments at 7.42 months.


💰 Mortgage & Financing Update

On June 4th, the Bank of Canada held its benchmark rate steady at 2.75% for the third consecutive time, citing economic uncertainties stemming from global trade tensions. Fixed mortgage rates have seen slight increases, with RBC raising its 3, 4, and 5-year fixed rates by 5 basis points.


🧭 Guidance for Buyers & Sellers

Buyers:

  • More Options: The surge in listings provides a broader selection. Take your time, conduct thorough due diligence, and don't rush decisions.

  • Upgraders: Ensure you have a clear understanding of the financial implications of selling and buying in the current market.

  • Downsizers: Smaller detached homes and townhouses are seeing increased competition as they align better with buyer purchasing power.

Sellers:

  • Preparation is Key: With increased competition, focus on the 3 Ps: Preparation, Price, and Promotion.

  • Entry-Level Homes: Still in demand.

  • Larger Detached Homes: Be prepared for a longer selling window. Strategic pricing and marketing are essential.


🔮 Market Outlook

The GTA housing market is experiencing a transition. While certain segments remain competitive, the overall increase in inventory provides buyers with more leverage. Sellers need to adapt to the changing dynamics by ensuring their properties are well-prepared and competitively priced.


Need personalized advice? Whether you're buying, selling, or just exploring your options, we're here to help you navigate the evolving market landscape.

👉 Contact Us for a consultation tailored to your needs.

Call Ben at 905-995-23372 or Jim at 905-409-9967

MORE MARKET INSIGHTS (Markham/Stouffville & Port Hope/Cobourg)

Read

August 2024 RE Market Recap: Real Estate Sales in the GTA

Is housing in the GTA becoming more affordable?

GTA home sales fell 5.3% year-over-year in August 2024, with a slight increase in new listings. Despite a modest dip in average home prices, the market remains well-supplied. Recent Bank of Canada rate cuts are expected to enhance affordability, especially for first-time buyers.

Market Summary

  • Sales Momentum: Sales decreased by 5.3% compared to August 2023 and 7.72% from July 2024.

  • Listing Dynamics: New listings were up 1.5% year-over-year but down 23% from July 2024.

  • Active Listings: Active listings increased by 46% from 2023 but saw a 5.1% decline from July 2024.

  • Price Trends: Average home prices were down 0.8% year-over-year and 7.72% from July 2024.

  • Market Status: With 5 months of inventory, the GTA market is currently in a buyer's market. Sales to new listings ratio fell 3% from 2023 but rose 7% from July.

  • Time to Sell: Listings spent an average of 28 days on the market, while properties were on the market for 44 days.

What's happening locally? Toronto Market Insights

Every city/town is unique as are the communities within them. Scroll through to find your town.

Impact of Interest Rates

On September 4th the Bank of Canada reduced it’s policy rate for the third straight time by a quarter point. The Bank of Canada’s recent rate cut is poised to improve housing affordability, particularly benefiting those with variable-rate mortgages. As borrowing costs decrease, we anticipate increased first-time buyer activity, which could stimulate the condo market and overall housing demand.

What Does This Mean for Buyers and Sellers?

For Buyers

Buyers will find favorable conditions with lower mortgage rates and modestly reduced home prices. The current market offers more choices, particularly in the condo sector, making it an opportune moment for those looking to enter or upgrade within the market.

For Sellers

Sellers in the GTA may experience a slower pace of sales due to the year-over-year decline, despite a stable inventory. With average prices slightly down, sellers should be prepared for modest offers but can benefit from increased buyer interest as affordability improves over time.

In Conclusion 

The GTA housing market is navigating a period of adjustment with declining sales and slightly lower prices. The recent rate cut promises to boost affordability and buyer activity, setting the stage for a gradual market recovery.

Get the Help You Need:

Ready to buy or sell in the GTA? Contact us today for expert guidance and personalized support to navigate this evolving market and make the most of current opportunities.

Call Ben at 905-995-23372 or Jim at 905-409-9967

Read
Categories:   2022 | 2023 | 2024 | 2024 Real Estate Market | 2024 Year in Review | 2025 | 2025 Real Estate forecast | 2025 real estate predictions | 2026 | 2026 Real Estate Forecast | Ajax Real Estate | Amberlea, Pickering Real Estate | Annex, Toronto C02 Real Estate | Anti-Flipping Tax | APSLEY Real Estate | Apsley, North Kawartha Real Estate | attractions | back to school | Bank of Canada | Bay Ridges, Pickering Real Estate | bayview mills | Bendale, Toronto E09 Real Estate | Benjamin Tal | best lawn fertilizer | best weed killer | Blue Grass Meadows, Whitby Real Estate | Bowmanville Real Estate | Bowmanville, Clarington Real Estate | Bridle Path-Sunnybrook-York Mills, Toronto C12 Real Estate | Bridle Path-Sunnybrook-York Mills, Toronto Real Estate | Brooklin, Whitby Real Estate | buy first or sell first | Buy or Sell First | buyers | buying a home | C12 | Canada Economy | Centennial, Oshawa Real Estate | Central Oshawa Go Train Station | Central West, Ajax Real Estate | Central, Oshawa Real Estate | Chandos, North Kawartha Real Estate | Christmas | Christmas Markets | CIBC | City Centre, Mississauga Real Estate | City of Oshawa | Clarington Real Estate | Clarington, Durham Real Estate | clean gutters | clean gutters and downspouts | cleaning your deck | comparable homes | comparable sales | comparative market evaluation | Condo Townhome | corn gluten | corn gluten meal | coronavirus | Courtice, Clarington Real Estate | covid-19 | covid-19, coronavirus | credit card rate cuts, mortgage payment deferrals, COVID-19, coronavirus | curb appeal | December 2023 Market Update | deck | Donevan, Oshawa Real Estate | downspouts | Downtown Whitby, Whitby Real Estate | drainage | Durham | Durham Region | durham region home sales | durham region tourism | Fall Market | farms in durham | February 2023 | February 2024 | fertilizer | financing | Foreign Buyer Ban | Galway-Cavendish and Harvey Real Estate | gardens | Go Train | Go Transit | government of ontario | GTA | GTA Real Estate Stats | gutter | gutter guards | gutter maintenance | gutters | Highlands East Real Estate | Holiday Markets | Holiday Season | home maintenance | Housing Forecast | interest rates | Ipsos | January 2023 | January 2026 Real Estate Market | July 2023 | June 2023 | June 2026 Market Snapshot | Lakeshore East Go Train Expansion | Lakeview, Oshawa Real Estate | lawn | lawn and garden | lawn care | leak prevention | Little Lake, Cramahe Real Estate | Local | local artisans | lush green lawn | Lynde Creek, Whitby Real Estate | Maker Markets | March 2023 | March 2025 | market | market evaluation | Market Outlook | market snapshot | Market Stats | market update | market watch | May 2023 | May 2024 | May 2025 Market Snapshot | McLaughlin, Oshawa Real Estate | mortgage | mortgage rates | Mother's Day | New Development in Central Oshawa | Newcastle, Clarington Real Estate | Newtonbrook East, Toronto C14 Real Estate | North Kawartha Real Estate | north york real estate | Northglen, Oshawa Real Estate | Northwest Ajax, Ajax Real Estate | October 2023 | ontario | ontario government | Open Offer Process | oshawa | Oshawa Real Estate | oshawa botanical garden | Oshawa Go | Oshawa Real Estate | Oshawa, Durham Real Estate | Parade | parenting | parks | peony festivael | pick your own strawberries | Picks & Giggles | Pinecrest, Oshawa Real Estate | Port Whitby, Whitby Real Estate | price my home | Pringle Creek, Whitby Real Estate | re-open | real estate legislation | Real Estate Market | Real Estate Market Stats | Real Estate Statistics | real estate stats | Real Estate Trends | Redevelopment in Durham Region | ReMax | Remembrance Day | Residential Commercial Development in Oshawa | ribfest | Rolling Acres, Whitby Real Estate | Rouge E10, Toronto E10 Real Estate | Rural Cramahe, Cramahe Real Estate | Rural North Kawartha, North Kawartha Real Estate | Rural Whitby, Whitby Real Estate | sales forecast | Samac, Oshawa Real Estate | Santa | Santa Claus | Santa Claus Parade | school | September 2023 | site seeing | social distancing | South East, Ajax Real Estate | South West, Ajax Real Estate | spring cleaning | spring market | st andrews | strawberries | summer events | summer home maintenance | Toronto | Toronto C10 Real Estate | Toronto E10 Real Estate | Toronto real estate | Toronto Regional Real Estate Board | Toronto Vacant Home Tax | Toronto W09 Real Estate | Trent Lakes Real Estate | TRESA | TRREB | TRREB Stats | Trust in Real Estate Services Act | week killer | Whitby Real Estate | Williamsburg, Whitby Real Estate | windfields | York Mills | Zoocasa
This website may only be used by consumers that have a bona fide interest in the purchase, sale, or lease of real estate of the type being offered via the website. The data relating to real estate on this website comes in part from the MLS® Reciprocity program of the PropTx MLS®. The data is deemed reliable but is not guaranteed to be accurate.